As most plan sponsors are well aware, the rapid increase in interest rates year-to-date has significantly reduced the size of their defined benefit pension liability. The discount rate for an illustrative liability with a duration of 12 years increased from 2.71% (12/31/21) to 5.61% (10/31/22), resulting in a 28% reduction in the size of the liability in 2022 so far.[1] That said, changing rates can impact plans in ways beyond the size of the liability.
In the following, we analyze some of the more nuanced ways rapidly increasing rates have impacted pension plans this year:
#1: Lump Sum Conversion Rate
Many plans with traditional annuity-based benefits offer participants the option to receive their payment as a single lump sum. The applicable interest rates that are used as an input to calculate the minimum size of the lump sum are determined by the IRS and are often held constant for the entire plan year, depending on plan provisions.
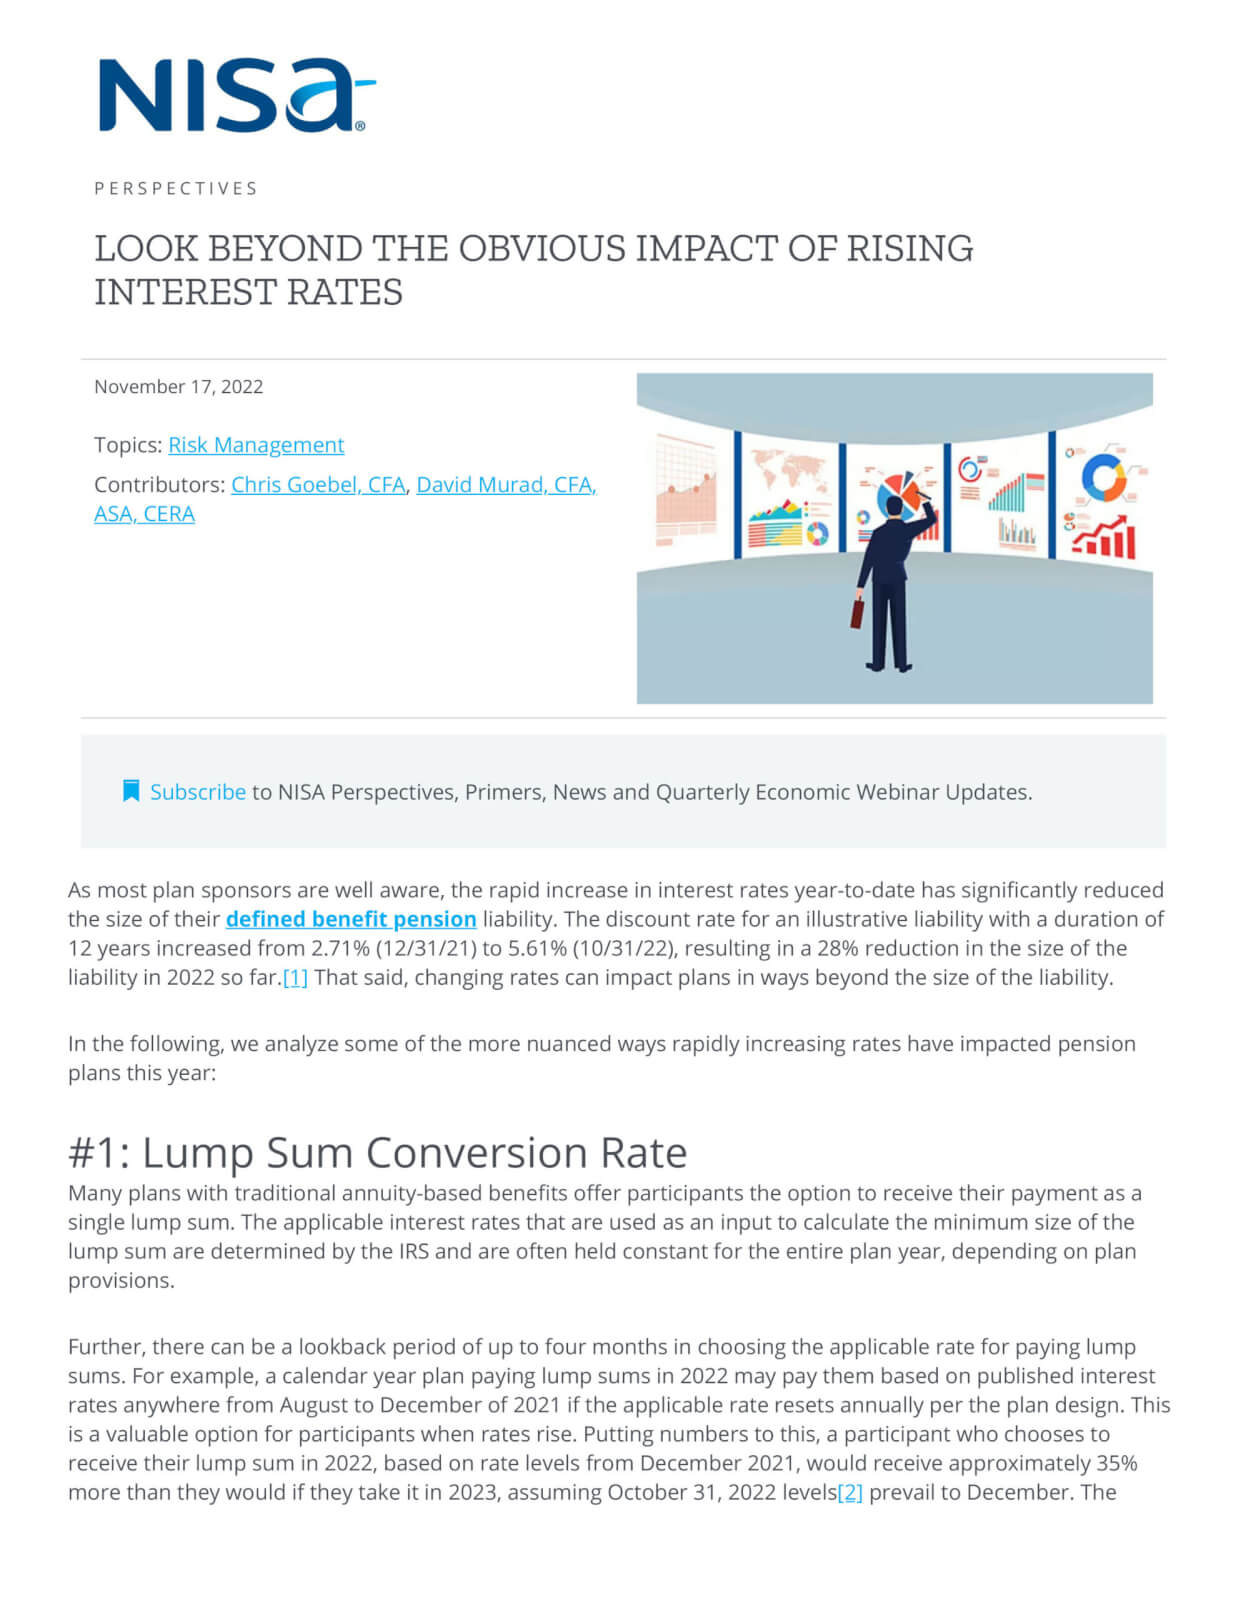
Further, there can be a lookback period of up to four months in choosing the applicable rate for paying lump sums. For example, a calendar year plan paying lump sums in 2022 may pay them based on published interest rates anywhere from August to December of 2021 if the applicable rate resets annually per the plan design. This is a valuable option for participants when rates rise. Putting numbers to this, a participant who chooses to receive their lump sum in 2022, based on rate levels from December 2021, would receive approximately 35% more than they would if they take it in 2023, assuming October 31, 2022 levels[2] prevail to December. The liability for this participant would therefore be settled at about a 35% premium relative to where it was marked based on the underlying annuity,[3] reducing funded status if this benefit was hedged on an annuity basis.
While this already presents an issue with regard to steady lump sum payments, higher rates can also impact take-up rates. In most years, the lagged nature of the annuity to lump sum conversion rate would not be expected to have a material impact on participants’ retirement date or payment form. However, the magnitude of the impact in 2022 has been recognized by some participants (or their financial advisors), and some plans are experiencing an increase in lump sum payment activity. This issue can be exacerbated for plans using lookback rates. Towards the end of the year, the lump sum payable to a participant in one year versus the next—and any potential substantial difference—effectively becomes known.
While in this section we focus on non-hybrid plans that would convert from annuities in offering lump sums, it is also worth noting that the opposite sort of dynamics may play out for hybrid plans that would convert from lump sums to offer annuities. In this case, higher rates increase the annuities calculated for a given lump sum if the conversion rate is not fixed.
#2: Cash Balance Crediting Rate
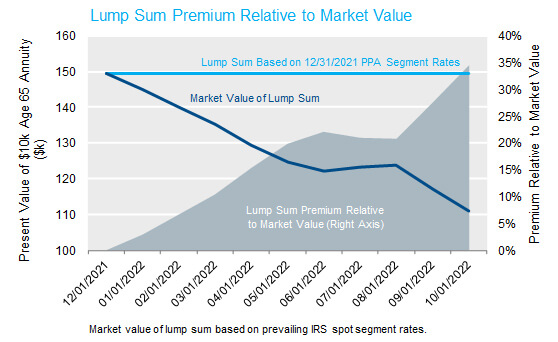
Traditional cash balance plans provide participants with a benefit expressed as a notional account which grows over time based on a prescribed Interest Crediting Rate (ICR). The ICR is typically based on a U.S. Treasury bond yield and may include an additional spread. For example, a plan may credit balances each year based on the 5-year treasury yield as of December of the prior year plus 25 basis points. Plans like this are often appropriately thought of as having roughly zero overall treasury rate duration because the liability impact associated with changes in the ICR is generally offset by changes to the discount rate. While outside the scope of this post, cash balance liabilities often have material exposure to changes in the shape of the yield curve despite this zero overall duration.[4]
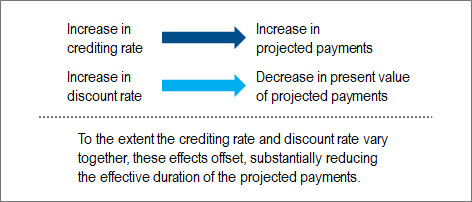
A floor on the ICR changes this dynamic. Many cash balance plans also designate a minimum ICR in a given period (e.g., 4%). Economically, this floor adds option value to a liability that could easily be missed. In the last few years, it was common for such plans to assume, very reasonably, that the ICR was essentially fixed since rates were so far below these floors and therefore, projected benefit payments were not sensitive to changes in rates. However, these projected payments were still discounted based on prevailing market rates, so the liability had duration.
Setting aside the complexities of determining exactly what the duration is for a plan with a floor, 2022 is a model year for illustrating why this concept can matter. The ICR reference rates for many plans will have breached the floor and the plan will move from a position where interest is credited at a fixed floor rate to a position where interest is credited based on the floating underlying reference rate, resulting in a lower effective liability duration.
#3: PBGC Variable-rate Premium
Variable-rate Premium (VRP), the annual charge assessed by the Pension Benefit Guaranty Corporation (PBGC) on the unfunded vested benefits of a pension plan has increased dramatically in recent years to 4.8% for plan year 2022 and 5.2% for 2023.[5] Increases in VRP were a catalyst for some plans to accelerate contributions and de-risk in recent years even as Minimum Required Contribution (MRC) calculations became less onerous. However, some plan sponsors may be surprised to find out that despite the fact that their plan remains fully funded from an accounting perspective, VRP may be required.
Plans have two options for calculating unfunded vested benefits for determining VRP requirements. Under the Standard Premium Funding Target methodology, the discount rate is based on one-month average “spot” segment rates, while under the Alternative Premium Funding Target methodology, the discount rate is based on what the plan sponsor used for MRC purposes (though without the 25-year smoothing, corridors and 5% floor stabilization adjustments). Most plan sponsors use stabilized rates for MRC, so the Alternative method would use the 24-month average rates. Given this, in upward trending rate environments, the Standard method will result in a higher discount rate, lower liability value and lower VRP as compared to the Alternative method using a 24-month average. The difference is especially stark this year due to the magnitude of rate increases. This will likely have major implications for VRP calculations going forward. For example, the applicable discount rate for the 2023 VRP for the illustrative 12-duration liability based on NISA-estimated spot segment rates as of October[6] would be 5.75%, versus 3.21% based on 24-month average segment rates[7]. The liability present value would be 39% higher.
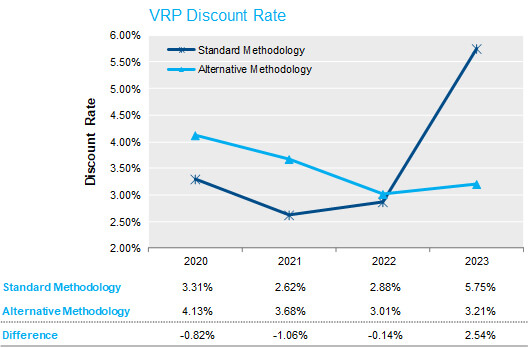
“Standard Methodology” based on spot segment rates as of the end of the previous calendar year. “Alternative Methodology” based on 24-month average rates as of the end of August of the previous year. Rates projected though December 31, 2022 based on NISA-estimated spot PPA curve as of October 31, 2022. Discount rates based on illustrative 12-duration liability.
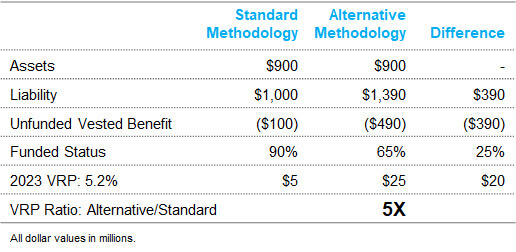
To put this into context, consider the comparison in the table below. Assuming the illustrative plan is 90% funded based on the standard methodology, it would be 65% funded based on the alternative methodology. Required 2023 VRP based on the alternative methodology would be five times what it would be based on the standard methodology[8].
Plans may only switch PBGC VRP methodologies if they haven’t done so in five years, so a plan that last switched in 2018 wouldn’t be eligible to change again until 2023. Calendar year plans, which will have already filed for and paid their 2022 premiums, have until October 16th, 2023,[9] to make an election for 2023 and would be eligible to make a change if the last switch was prior to the 2018 plan year.
Another option for plans stuck with the Alternative method that would like to reduce VRP is to change the discount rate methodology used for calculating MRC to the full yield curve methodology. However, once a plan makes this switch, there is no guarantee that it can revert back, leaving risk of permanently giving up all of the smoothing, corridoring and flooring that came with several rounds of pension relief since the original passage of PPA. This decision should be discussed with actuaries, consultants and other stakeholders.
Other Pension Liability Rate Sensitivities
While we have briefly described three subtle ways in which pension plans may be impacted by rapidly rising rates, there are certainly others, like the following:
- Funding Target Liability Calculations – Funding Target Liability calculated using segment rates based on permissible corridors around the 25-year average may now result in a higher liability value (lower discount rate) versus using the full PPA spot curve. Therefore, some plans that are fully funded on an accounting basis, may face required contributions if they elect to use adjusted segment rates based on ARPA/IIJA[10] Look for a deeper dive on this topic in the future from us.
- Greater-Of Benefits – Plans that pay benefits based on the greater of a cash balance formula or traditional pay/service-based formula may experience liability shifting from traditional to cash balance as interest crediting rates increase, resulting in a lower effective duration of the liability.
- Plans with Ongoing Accruals – Plans with ongoing accruals may experience a liability increase associated with increases in wage growth in a rising inflation environment. To the extent that increases in inflation translate to increased compensation, pay-based benefits would be expected to increase.
- Floor-Offset Plans – The impact of rising rates on floor-offset plan liabilities is dependent on plan circumstances. Taken in isolation, rising rates would cause the put provided by the DB plan to move further out-of-the-money as DC fixed-income assets generally hedge less than 100% of the annuity liability. However, declining return-seeking asset values during this time period offset the reduction in the liability and moves DC asset values closer to the floor provided by the DB plan.
Conclusion
The effective interest rate sensitivity of defined benefit pension liabilities is more nuanced than the discounted present value of fixed projected cashflows. Each plan is unique, and a detailed understanding of plan characteristics and design features is necessary to profile the liabilities’ exposure to interest rates. The rapid rise in rates experienced so far this year has clearly revealed some of the “hidden” sensitivities of plans. As plans continue to increase the precision of their hedge versus the liability, it is even more important that a well-designed strategy recognize and incorporate these less obvious sources of liability interest rate risk.
If your plan includes any of the features described in this post, reach out to your NISA Client Services representative to discuss your plan’s specific circumstances.[11]
[1] Based on the FTSE Above Median Pension Discount Curve.
[2] Based on an age 65 immediate annuity converted to a lump sum at PPA spot segment rates. While the prescribed mortality rates may be different across the two years, the same age and 2022 417(e) mortality table are used for calculation of the impact to isolate the effect of changes in rates.
[3] This annuity substitution methodology is generally useful for evaluating the duration of the liability of participants not taking lump sums based on a fixed conversion rate i.e., people who may take lump sums further out in the future. Other differences in mortality and rate assumptions for the liability being hedged may also impact this estimate.
[4] See NISA webinar, The Island of Misfit Pensions, December 20, 2021, for a more in-depth discussion of yield curve exposure of cash balance plans https://www.nisa.com/webinars/nisa-client-webinar-the-island-of-misfit-pensions/.
[5] Subject to a per-participant cap of $598 and $652, respectively.
[6] The actual comparison would use December 2022 “spot” rates for the Standard method, which for the purposes of this illustration, we assume will be the same as NISA-estimated segment rates based on rates at the end of October 2022.
[7] While the concepts in this section also apply to small plans that use the “Lookback Rule,” we focus on all other plans in these illustrations.
[8] This assumes that the per participant cap isn’t reached. The ratio changes depending on the funded status using the standard methodology. For example, if the plan was >100% funded based on the standard methodology, no VRP would be required on that basis and the ratio would not be applicable.
[9] Generally, the election must be made by the Normal Premium Due date, the 15th day of the 10th full calendar month in the plan year, adjusted for weekends or holidays.
[10] The American Rescue Plan Act (ARPA), signed into law on March 11, 2021, revised the rules for determining adjusted 25-year average segment rates. The rules were subsequently modified again on November 21, 2021 through the Infrastructure Investment and Jobs Act (IIJA), which further delayed the phase out until 2031.
[11] For more details on concepts and plan design features described in this post, see NISA webinar Island of Misfit Pensions and associated slides available at https://www.nisa.com/webinars/nisa-client-webinar-the-island-of-misfit-pensions/.