A new analysis of the Final SFA Rule shows that plans receiving ARPA relief could surpass goals.
When the Special Financial Assistance (SFA) provisions were originally published in 2021 by the PBGC as Interim Final Rules, it seemed unlikely eligible multiemployer plans would achieve the intended goal of maintaining solvency through 2051. However, with the recently published Final Rule, our analysis that follows shows this is no longer the case.
On Friday, July 8th, 2022, the Final Rule regarding the Special Financial Assistance (SFA) program pursuant to the American Rescue Plan Act of 2021 (ARPA) was published to the Federal Registrar. As mentioned in a previous publication, the program provides much needed relief to multiemployer plans and provides greater benefit certainty for plan participants for years to come.
The revisions in the Final Rule of the program could materially increase the ability for plans to make the ARPA-required benefit payments for the next 30 years[1] — and potentially much further into the future. Two primary revisions materially impact the outcome:
- Allowance of Return Seeking Assets
The modified rules allow plan sponsors to invest up to 33% of SFA relief assets in return-seeking assets (RSAs) and more explicitly state what kind of fixed income assets are allowable in their pension portfolio. Publicly traded investment grade securities can be used in the relief portfolio. However, more complex investment-grade fixed income investments such as Collateralized Loan Obligations (CLOs), Collateralized Debt Obligations (CDOs) and Collateralized Mortgage Obligations (CMOs) along with private credit are effectively excluded. - Modified Discount Rate Methodology
The methodology used to calculate the amount of relief assets make it possible for total assets to earn an average return that meets or exceeds the discount rate. Our analysis finds that makes it far more likely that plans receiving relief assets will achieve and surpass the stated goal of solvency through 2051. While assumed earnings on legacy assets will continue to be based on the third segment rate[2] plus 200 basis points (bps), earnings on relief assets will use an average of the three segment rates plus 67 bps. In the Appendix we discuss the importance of smoothing and how the recent increase in rates provides a disconnect between these assumed interest rates and actual bond yields which can benefit plans.
The above changes likely impact what was a desired (or even required) strategy for investing the relief assets. They will further allow plans to adopt de-risking and interest rate matching strategies while maintaining confidence in their ability to make benefit payments far into the future. Other changes may include less reliance on manager alpha and the ability to use a higher credit quality investment grade benchmark, while still meeting investment objectives.
Within this analysis we investigate:
- The impact of various fixed income strategies on a plan’s solvency
- Considerations for determining the appropriate fixed income strategy
- The need for RSAs as part of the relief pool
- Key risks associated with various investment strategies and potential outcomes
Based on the Final Rule provided by the PBGC, our analysis utilizes the following assumptions:
- No less than 67% of relief assets will be allocated to investment grade fixed income.
- The amount of relief assets a plan will receive is based on a projection method that deterministically forecasts benefit payments and expenses paid out of the plan against relief assets and legacy assets, contributions into the legacy asset pool, and projected earnings on both asset pools using the prescribed discount rates. The amount calculated is the minimum required for plans to remain solvent through 2051.[3]
- Derivatives are not utilized in a material way. For purposes of our analysis, we do not allow derivatives to extend duration of the fixed income portfolio beyond 25 years.
- No additional restrictions will be placed on the legacy assets. However, at no point in the analysis will the total return-seeking portfolio (across both legacy and relief assets) exceed 50%.
- While plans that suspended benefits under the Multiemployer Pension Reform Act of 2014 (MPRA) have a number of special rules that may apply, these were not incorporated in this analysis. However, we expect the conclusions to remain the same.
For illustrative purposes, we use a 12-year duration liability when discounted at the FTSE Pension Discount Curve. We assume plans use an applicable EROA-based discount rate of 7.5%.[4] We apply a stochastic approach to simulate future interest rates, credit spreads and equity returns. A high-level overview of the assumptions is listed in Figure 1:
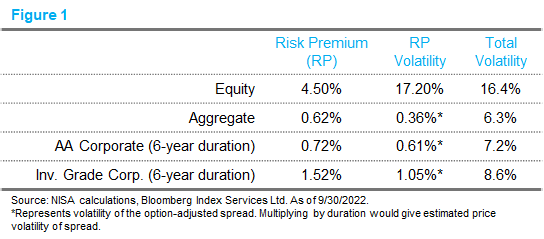
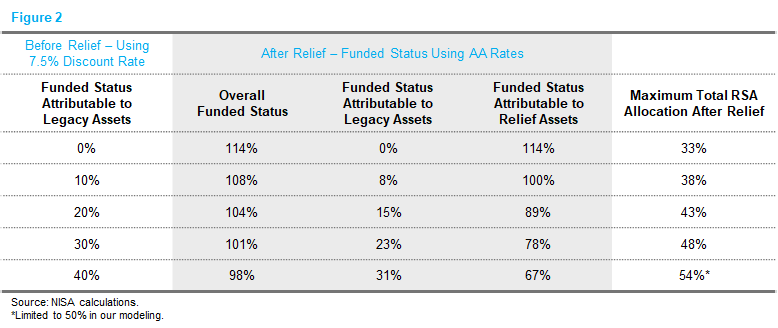
The starting funded status of this plan after receipt of relief assets will vary depending on the initial amount of legacy assets. Figure 2 shows the resulting funded statuses using the FTSE Pension Discount Curve[5] as of 9/30/2022.
Measuring Success
We focus on two metrics for comparing strategies:
- Years until total assets are exhausted
- Probability of making the next 30 years of benefit payments
For each strategy we examine the tail outcomes. A strategy may do relatively well in the expected case but result in relatively poor outcomes at the 5th percentile, e.g., a one-in-20 downside outcome. Understanding downside scenarios can be very useful for developing an investment strategy.
While we believe the assumptions used in this paper are reasonable, every plan, consultant, and actuary will have different assumptions. While this may impact results, we believe the relative tradeoffs between strategies and “big picture” questions are less sensitive to underlying assumptions. This model provides a fairly robust framework for designing an appropriate fixed income investment strategy for the relief assets and also assesses the importance of return-seeking assets in the relief asset pool.
Traditional Fixed Income Strategies
For many eligible plans, the default fixed income benchmark is the U.S. Aggregate. This benchmark contains a substantial allocation to zero-spread or low-spread securities. By switching to a similar duration corporate benchmark, we can assess the impact of switching entirely to all investment grade corporate securities. As of 9/30/2022, the spread on Bloomberg U.S. Aggregate index was 62 bps; a similar duration investment grade corporate benchmark would have 152 bps of spread[6].
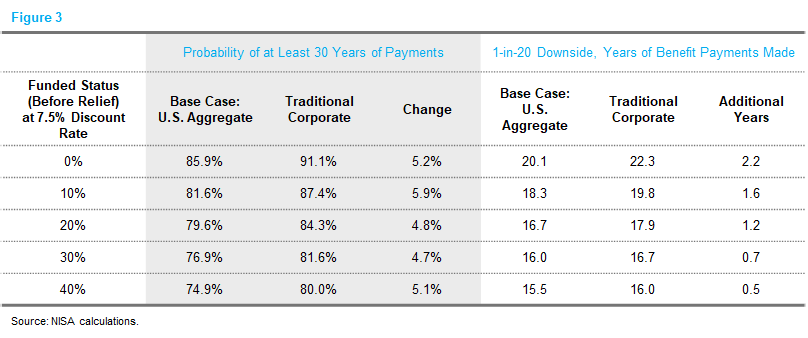
With the significant improvements to the Final Rule as well as a material increase in investible rate levels, we expect plans to be able to remain solvent in the median case for at least 40 years barring a large decrease in rates prior to investing relief assets. In Figure 3, we look at the impact of moving from the Aggregate to a similar-duration corporate benchmark on the tails of the distribution and on the overall probability of achieving solvency for at least 30 years. For a 12-year duration liability, this results in improvements across the board, regardless of initial funded status. For instance, a plan that was initially 20% funded on an Expected Return on Assets (EROA) discounting basis, has a 4.8% increased probability of surpassing 30 years of benefit payments and has 1.2 additional benefit payment years in a one-in-20 downside scenario. In the tails, it is important to understand what can drive insolvency. While corporate bond defaults can play a role, a significant amount of the risk is reinvestment risk associated with a shorter duration asset pool.
Solvency Driven Investment (SDI) Strategies
SDI strategies provide a way for sponsors to manage risk associated with the future outgoing cashflow stream, accounting for the timing of benefit payments and other expenses. They do so by seeking to “lock in” or reduce the future variance of assets against the present value of the total cashflow stream or some subset of it today. While SDI strategies should play an important role in many pension portfolios, this is especially underscored with these plans given relief assets make up a substantial portion of the total portfolio and the stated objective of providing 30 years of benefit payments for participants.
Solvency focused strategies are not a one-size-fits-all strategy, and each plan’s unique sensitivities may shift the implementation plan. As such, NISA explores three strategies which could have varying levels of applicability depending on a plan’s sensitivities to downside risk, ability/willingness to use derivatives, future contributions and cashflow duration. All the SDI strategies in our analysis are compared to the U.S. Aggregate strategy as a base case. In principal, by “locking in” the present value of the cashflow stream, there is more certainty surrounding what equity returns, if any, would be needed to close the gap.
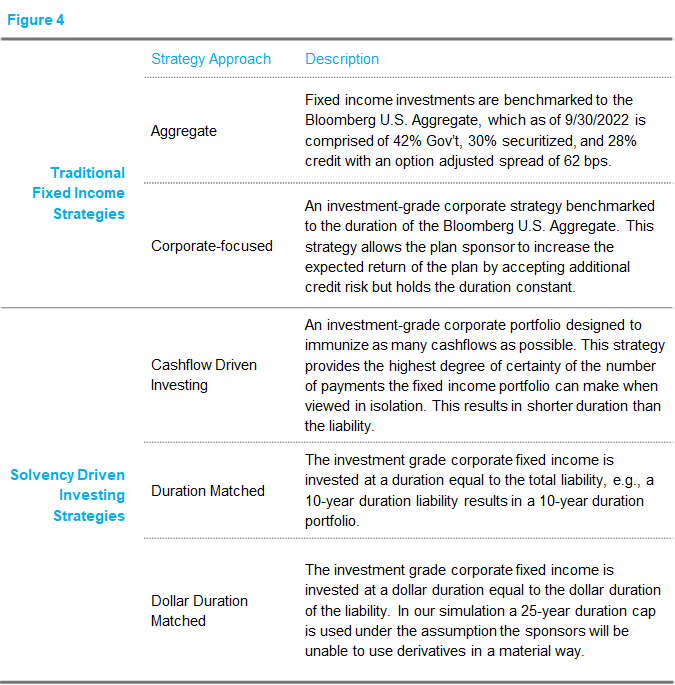
The cashflow driven strategy, which generally results in the shortest duration portfolio[7], constructs a fixed income portfolio to cashflow match the expected benefit payments and expenses. Said differently, fixed income assets’ cashflows are matched to outgoing payments starting in the first year until they are exhausted. Beyond that point, RSA would make future benefit payments. This structure provides an exceptionally high degree of certainty around payments that are immunized, but does not provide protection against changes in the present value of longer-dated cashflows. Potential rebalancing between RSA and fixed income may require adjustments to the fixed income cashflow ladder. In following this strategy, legacy fixed income assets are assumed to be incorporated such that fixed income across the entire portfolio is cashflow matched in aggregate.
The duration matching strategy invests the fixed income assets at the duration of the total cashflow stream. This is not a perfect cashflow match but typically extends the portfolio duration modestly beyond a cashflow matching strategy. For plans that desire a more traditional benchmark, this strategy can be easily implemented using a blend of long and intermediate corporate or credit indices structured to hit the desired duration target.
The third strategy seeks to match the entire dollar duration of the cashflow stream. In an entirely unconstrained framework, this strategy would be able to use derivatives to match the total interest rate sensitivity of the cashflows. However, given the unique nature of the relief assets and restrictions on relief and legacy assets, a maximum duration of 25 years was implemented. This constraint becomes binding when legacy assets make up a higher allocation of the portfolio (although this also means there are more assets not subject to regulatory constraints).
While not the primary focus of this paper, under the new rules, it may be appropriate for portfolios to use a higher allocation to Treasuries given a potentially lower need for spread exposure and the risk that comes with it. This may, in turn, influence the RSA allocation. For example, a plan could blend Treasuries and RSAs to approximate the spread exposure of investment grade corporate bonds or alternatively pursue a lower risk strategy.
Figure 5 shows the outcomes for the solvency-based strategies versus the base case and the traditional corporate case.
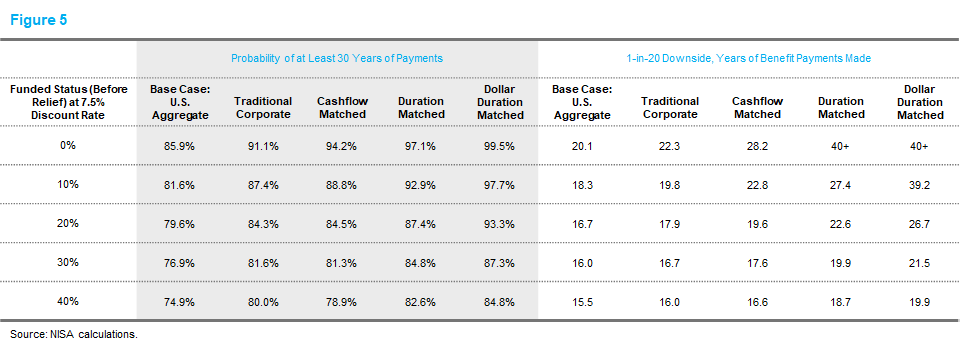
Across the board, we see a healthy pickup in expected years of benefit payments in a downside scenario between the cashflow matched and a U.S. Aggregate strategy. Additionally, the probability of making 30 years of benefit payments increases substantially. Duration and dollar duration matched strategies provide even more improvement over the base case. Since these two strategies tend to have longer durations, this improvement is in no small part the product of a reduction in reinvestment risk and a modestly upward sloping spread curve.
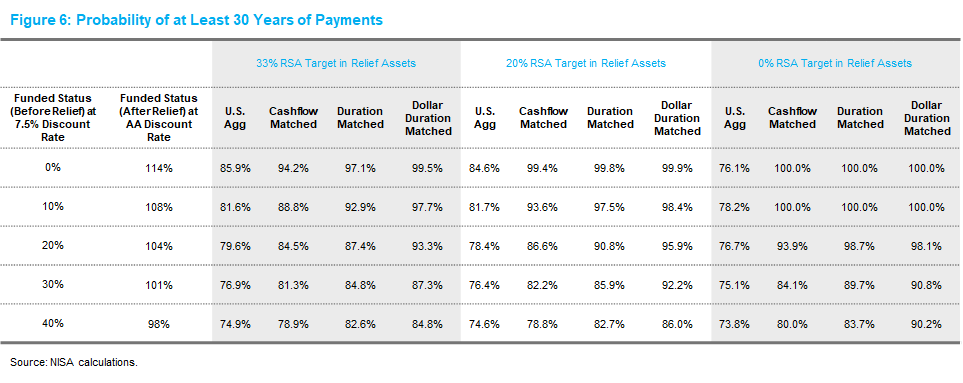
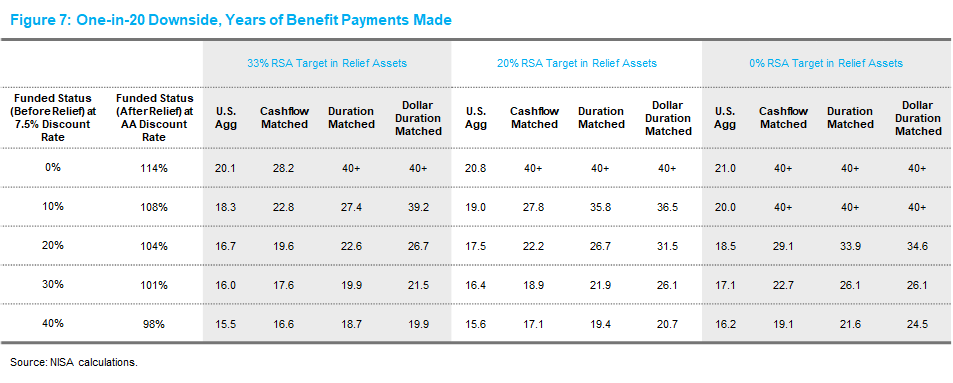
Inclusion of RSAs in Relief Portfolio
The scenarios above assumed RSAs are utilized to the maximum allowable extent as part of the relief portfolio. In our prior Perspectives, which assessed outcomes under the Interim Final Rule, we included figures indicating median projected years of benefits paid. As things currently stand, the median outcome for any target allocation to RSAs within the relief asset portfolio[8] now suggests that benefit payments can be made for at least 40 years, regardless of the chosen fixed income strategy. This is largely due to the fact that current market interest rates exceed the prescribed 24-month average discount rates and spreads used to calculate the amount of relief received. The tails of the distribution, and a closer look directly at the probabilities of achieving at least 30 years of benefit payments do tell a different story and suggest a potentially lower need for RSA, which can be seen in Figures 6 and 7. In fact, for plans with a lower initial funded ratio before relief, the need for equity could be the least because the mark-to-market funded ratio after relief is higher for initially less-funded plans.
The relative tradeoff between anticipated excess returns and risk will ultimately be a function of market rates and pricing at the time plans are actually able to deploy relief assets.
Special Rebalancing Considerations
The new rules can bring about some complicated rebalancing questions for plan sponsors that utilize the maximum allowable relief portfolio RSA allocation of 33%. The 33% limit must be satisfied at least one day in any 12-month rolling period and at the time of any purchase of RSAs (excluding automatic re-purchase of capital gains and dividend reinvestment). A decline in the equity market could cause the allocation to RSAs to decline below 33% and potentially warrant a reallocation from fixed income. Ideally the fixed income strategy would account for this changing dynamic by adjusting the duration of the portfolio or in the case of a cashflow matching program sell the bonds related to the longer dated cashflows. Similar considerations may apply in the event a rebalancing from equity into fixed income is needed. For asset allocations which do not utilize the entire relief asset RSA pool this more complex rebalancing question can be largely ignored, and a sponsor can reasonably allow the RSA pool to fluctuate without disrupting the fixed income allocation.
Dynamic Strategies
The presented strategies are assumed to remain constant over the life of the plan. While this is likely for the foreseeable future, eventual changes to the investment strategy will be warranted. While outside the scope of this piece, shifting to a dynamic strategy as opportunities present themselves would likely result in better outcomes for plan participants. Some examples of potential environments and the corresponding portfolio adjustments include:
- Higher-than-expected RSA returns, decreases in participant longevity, and higher-than-expected manager alpha could allow for de-risking of both the legacy and relief assets. While we expect most plans to be very well-funded after receiving relief, adopting a de-risking glidepath as funded status improves would better protect beneficiaries.
- For plans that are less well-funded following relief, adjusting the fixed income strategy duration in the event of solvency improvements can be prudent. A plan that selects cashflow matching as a starting point may switch to a duration or dollar duration matched strategy as it becomes more feasible to make longer dated benefit payments because of positive movements in the equity market. Alternatively, depending on a plan’s objective and risk tolerance, they could choose to “lock-in” the 30 years of payments and switch more assets to a cashflow driven investing strategy.
- As relief assets are paid down, legacy assets will represent a growing percentage of the overall portfolio. While not explored in this paper, this too can have implications for investment policy design.
The key principle we offer here is that having flexibility to dynamically adjust policy allocations and adopt de-risking glidepaths should only improve outcomes for plan participants compared to static strategies.
Conclusion
The final PBGC rule provides a material increase in the probability that sponsors can not only make the next 30 years of benefit payments but expect to cover them well into the future. By shifting to a solvency focused investment strategy, a plan receiving relief can increase the probability of making 30 years of benefit payments by at least ~5 to 10%. Solvency focused strategies reduce uncertainty and allow for higher returns through risk management. The specific implementation will be based on plan cashflows, legacy asset allocation, capital market assumptions, and a plan’s willingness to trade off a higher expected outcome for more certainty during extreme events. Increasing asset duration and shifting to a solvency focused strategy provides greater certainty of outcome for participants, something which holds across different plans.
If you are currently evaluating the fixed income or overall investment approach for a multiemployer pension, please feel free to reach out to NISA on how the topics of this piece would be applicable to you.
Appendix
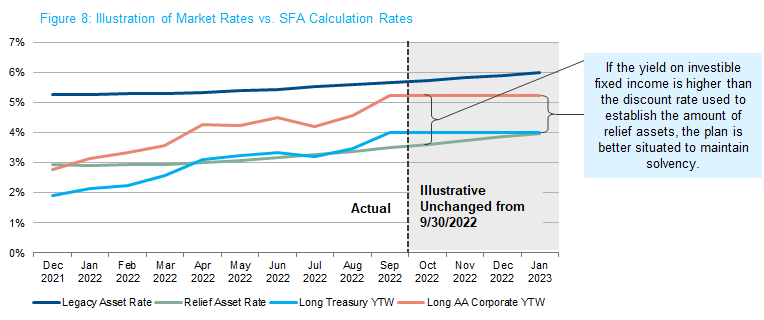
In Figure 8, we illustrate the dynamic that could happen if rates remain unchanged from September 30, 2022. The point here is that the plans receiving assistance can only invest relief assets at prevailing market rates, but the amount of SFA assets will be determined based on a 24-month average of rates, which were lower historically than currently prevailing rates. Should rates remain where they are or increase, plans will be able to invest assets at yields higher than the discount rate used to establish the amount of relief assets. This results in an assistance amount that is effectively more generous and therefore extends the amount of time plans will remain solvent.
[1] While the relief technically targets payments through 2051, we focus on a minimum of 30 years of payments throughout this paper.
[2] These segment rates are actually based on a 24-month average of A or better corporate bond rates under PPA.
[3] For the purpose of this analysis, non-investment expenses are lumped in with benefit payments. Additionally, the present value of future contributions and other inflows is considered to be part of legacy assets.
[4] Plans that use funding discount rates below the applicable 3rd segment rate + 200 bps (for legacy assets) and/or the applicable average of the three segment rates + 67 bps (for relief assets) will receive higher SFA all else equal since the assumed returns applied in the SFA calculations may use the assumed plan funding rate.
[5] While a number of factors will influence the actual calculation of SFA assets and therefore the funded status of a plan after receiving these assets, we believe Figure 2 represents a reasonable estimate of where the sample plan would be using the mark-to-market FTSE Pension Discount Curve and serves as a useful starting point to illustrate the value of various investment strategies without loss of generality.
[6] In our prior paper we assumed 50 bps of alpha, which was necessary under the original Interim Final Rule to have any chance of paying for benefits for 30 years. Under the new rule, while alpha may still be important and desirable, the need to rely on it is arguably removed due to the allowance to allocate to return-seeking assets. For the purpose of this paper, we have dialed down the assumed amount of alpha and now assume active management performance is just enough to offset the impact of defaults and credit migration.
[7] This may not be the case for plans that have more assets in fixed income than there are liabilities.
[8] Up to the allowed 33%.