Summary
In recent months we’ve observed that equity’s effective spread duration (ESD) seems especially pronounced—for example, the S&P 500’s ESD is currently about 25 years vs. its ten-year average of about 15 years. We thought it would be worthwhile to dig a little deeper to understand this dynamic. In a nutshell, below average spread volatilities and above average correlations between equity returns and spreads are fueling higher equity spread durations. For plan sponsors, that means that their equity allocations may be hedging more of their liability spread than they may have assumed, though this could change quickly.
Details
Plan sponsors often ask how much of the spread component of a liability discount rate is hedged by their equity portfolio. Unlike corporate bonds, where we can calculate spread duration directly and reliably compare that against the spread duration of a liability,1 we have no equivalently reliable methodology for equities. Instead, we have to estimate the spread duration of equity empirically. That is, we look at the historical relationship between equity returns and spread movements to provide our estimate. Specifically, we regress equity returns on changes in spreads. Since we are interested in the relationship between equities and liabilities, we use the change in liability spreads as our measurement of spread changes.
What struck me as interesting is how much this empirical estimate of equity spread duration—or effective spread duration (ESD)—has increased recently. Over the last 10 years, the average estimated ESD of the S&P 500 has been about 15 years.2 In practice that means if the spread component of the high quality corporate rates that plans typically use to value liabilities decline by 10 bps, we would expect the S&P 500 to increase in value by 1.5%. In the last year, however, this estimate has jumped markedly, reaching over 30 years at the end of 2015 and beginning of 2016, and currently hovering around 25 years. The chart below illustrates this dynamic.
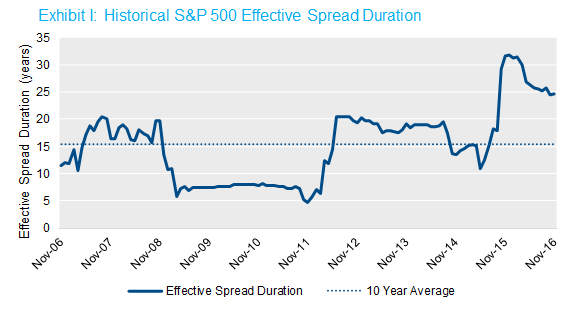
Source: NISA calculations based on data from Citigroup and Bloomberg through 11/30/16.
In theory, these abnormally high ESDs mean that a given allocation to equity now offers a larger liability spread hedge3—or, put differently, your equity is working harder from a hedging perspective. Yet before plans reassess their asset allocations and risk profiles, it may be worth digging deeper into what is driving this high estimate. To shed light on what is going on, let’s break the ESD down into its component parts.
We estimate effective spread duration by regressing equity returns on changes in spread over the same period of time. The beta or slope of that regression is equity’s ESD. Using the mathematical properties of regression, the beta can also be written as below in Exhibit II.
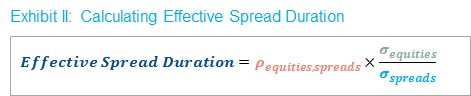
This equation illustrates how ESD can be decomposed into three statistical components: the correlation of equities and spreads, the volatility of equities, and the volatility of spreads. So, all else equal, if:
- Equity volatility (σequities) increases, ESD increases;
- Spread volatility (σspreads) increases, ESD decreases;
- And if the correlation between equities and spreads (ρequities, spreads) increases, then ESD increases.
The graph in Exhibit III below helps identify the culprits. It normalizes each of the three parameters based on its ten-year historical average, so that 0.0 means the estimate equals its 10 year average. While equity volatilities are about 25% below average, spread volatilities are more than 50% below average, and correlations between the two are about 20% above average. On a net basis, these three statistics are pushing ESDs higher—approximately 60% higher than the historical average. Note that for simplicity we’ve inverted the axis in the graph below for spread volatility to more clearly illustrate the directionality of the three forces on ESD.
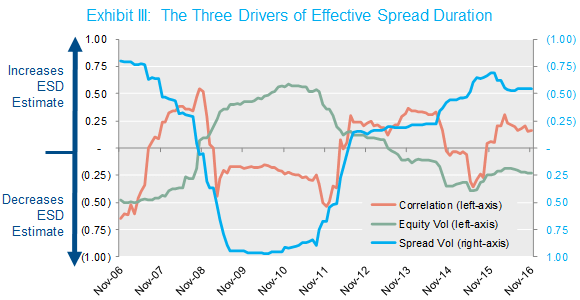
Source: NISA calculations based on data from Citigroup and Bloomberg through 11/30/16. Spread volatilities are based on the average discount rate (i.e., IRR) of an illustrative liability discounted at the Citigroup Pension Discount Curve and the Citigroup STRIPS curve. Correlations and volatilities based on the rolling three years of historical data.
What should plans conclude from these findings? While always urging caution (the standard error on the calculated effective spread duration is more than five years), we believe you should expect your equities to contribute more to a liability spread hedge than they have historically. Remember, though, that these numbers are estimates based on historical relationships that are erratic. Relationships between variables can shift and the current environment can and will change. Abnormally low spread volatilities are fueling these higher ESDs right now. If spread volatility ticks up, or if correlations and equity volatilities fall, the current environment could shift quickly.
1Of course, a bond’s price is perfectly related to its own yield by construction. A bond’s relationship with other bonds is in fact a similar empirical exercise to that of calculating equity’s effective spread duration. But since the correlation among spreads on high quality corporate bond indices is very high, we are ignoring this detail in this post.
2We have observed higher ESDs in other equity indices, but we will only reference the S&P 500 in this analysis.
3This is a reasonable guess, all else equal, with one very important caveat. This post is focused on effective spread duration – that is, how much do you expect equities to move for a given change in spreads. Importantly, however, the amount of equities you should hold to hedge your liability is not 1 / ESD. To answer that question, you would need to reverse the direction of the regression described above. Mathematically, the coefficient of this new regression would not be the reciprocal of the first regression. Put more simply, this analysis is descriptive, not prescriptive; it shouldn’t be interpreted as a way to back into an optimal equity allocation from a hedging standpoint.