Summary
We examined the statistics behind the claim that large pensions drag down a company’s valuation and accordingly how annuity buyouts allow a sponsor to remove this discount from their stock price. As you might have guessed, this conclusion rests on some erroneous assumptions and interpretations, and what makes for an exciting graph doesn’t quite translate into the real world of corporate finance.
Details
Over the years, we have seen analyses that suggest the size of a company’s pension liability impacts the valuation it receives from the market. Specifically, the story goes, the larger the pension, the lower the sponsor’s enterprise valuation.1 As one can think of a pension liability in similar ways to other capital structure elements (i.e. pension liability = debt and pension assets = assets), we are immediately suspicious of any balance sheet alchemy. Remembering the Modigliani-Miller theorem, we know that capital structure decisions should not affect a company’s value.2
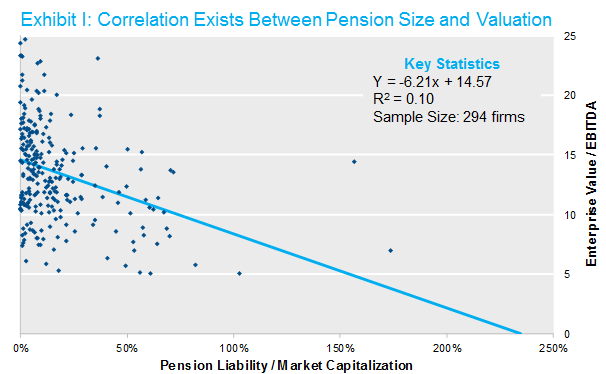
So as not to rely on an academic “theory,”3 we decided to perform some of our own empirical tests on this thesis. First, we reproduced results similar to what we have seen. Specifically, we regressed an estimate of firms’ valuations (in this case, enterprise value divided by EBITDA) on the size of the sponsors’ pension liability (projected benefit obligation (PBO) divided by market capitalization). This analysis provides a preliminary confirmation of the inverse relationship between pension size and company valuation — that is, large pensions lead to lower valuations. The results are shown in Exhibit I below.
 Sources: Capital IQ, Bloomberg, NISA Calculations.
Two points are worth highlighting: first, note the low R2, which implies that the explanatory value of these variables is limited. Second, the slope coefficient of -6.2 suggests a fairly remarkable relationship between pension size and valuation. That alone should raise some suspicions.
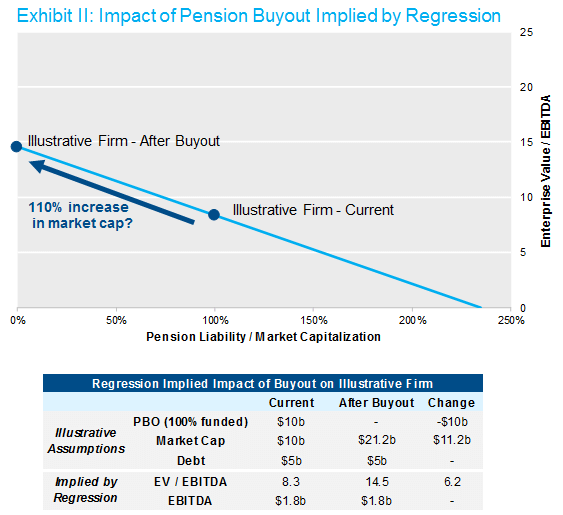
An example is illuminating. The chart and table in Exhibit II below show a hypothetical company with a $10b market value, $1.8b of EBITDA and a $10b fully funded pension — a company at 100% on the horizontal axis in Exhibit I. If we assume $5b of debt (arbitrarily, but without affecting our point), this illustrative firm has a 8.3 EV/EBITDA valuation. For the sake of argument, let’s also assume they can execute an annuity buyout at the PBO level (a simplifying and generous assumption). The resulting company would then move to 0% on the horizontal axis. Using our fitted relationship, that would imply a EV/EBITDA ratio of 14.5, or an astonishing 110% increase in market cap. Exhibit II illustrates the firm’s remarkable jump in value post-buyout.
 Sources: Capital IQ, Bloomberg, NISA Calculations.
Since we all know that annuity buyouts don’t cause a sponsor’s stock price to skyrocket, something else must be going on here. Our instincts tell us this is likely a case of reverse causality or omitted correlated right-hand side variables — or probably both.
It is tempting to interpret the graph in Exhibit I as suggesting causality, which often results in erroneous conclusions. (To pick an example: concert violinists generally own very expensive violins, but buying a Stradivarius will most assuredly not make me a concert violinist.) In this case, it could be that companies that have experienced more challenging business conditions see a reduction in market capitalization, which leads to larger PBO/market cap ratios because pension liabilities are ostensibly inert. If that were the case, the implied causality would be reversed — lower valuations lead to lower market capitalization, which predicts higher PBO/market cap ratios. That seems at least an equally plausible causality.
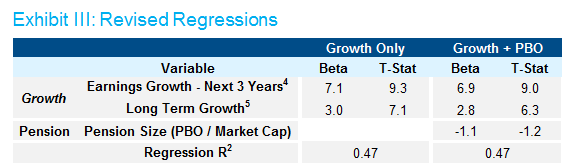
This thought leads naturally to our other concern. It is likely the case that other variables that are correlated with PBO/market cap are really driving the relationship here (remember the low R2). Importantly, unlike PBO/market cap, we would choose variables we expect would affect valuation. To avoid a data mining expedition, we chose the first variable that came to mind (earnings growth) and controlled for the equity sectors with dummy variables. The table below reports the regression results using these new variables.
 Sources: Capital IQ, Bloomberg, NISA Calculations.
The first regression (Growth Only) uses more intuitive predictors of valuation: growth in earnings and sector affiliation (dummy variables not shown). As expected, these variables are quite effective at explaining valuations, hence the more robust R2 of 0.47. Now, when we add the PBO/market cap variable in the second regression (Growth + PBO), its lack of usefulness is apparent. The R2 moves imperceptibly relative to the Growth Only regression and the new T-statistic is not significant. That supports our suspicion that PBO/market cap isn’t a variable that drives the valuation of a company.
The results above are not an attempt to comprehensively explain what drives a company’s valuation. Instead, they should help identify one variable (pension size) that conclusively does not.
We would argue that there is no magic at work here. The valuation of a company in the market is driven by multiple variables, and intuitive ones like growth-related factors do most of the heavy lifting. A focus on the relationship between a company’s valuation and the size of its pension in a vacuum can lead to mistaking the cart for the horse, or vice versa. If a causality is inferred then less than optimal corporate finance decisions can result.
Next time you come across one of these analyses, it might be worthwhile to remember the phrase that that great Missourian, Mark Twain, helped popularize: “There are lies, and there are damned lies. And then, there are statistics.”
We estimate this statement to be true 62% of the time.
One Additional Thought
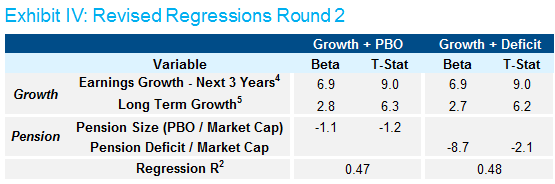
If that seems like a somewhat unsatisfying conclusion, there is one pension-related variable, however, that we suspect does affect the valuation of a firm: the size of the pension deficit. It does make intuitive sense that, all else equal, a company with a fully funded pension would be worth more than an otherwise identical company with an underfunded plan. Happily, we found some statistical support for this theory. We substituted pension deficit for pension size in the regression with the growth variables shown in Exhibit III above. The updated regression and the original are compared below.
 Sources: Capital IQ, Bloomberg, NISA Calculations.
Comparing the two regressions, there are a few points to note. First, while the pension size coefficient was not significant in the original regression, the pension deficit coefficient actually is. Another difference is that the overall R2 improved as well, albeit only by a small amount. The most important takeaway, however, is the pension deficit coefficient itself. That coefficient works out to mean that a dollar of pension deficit will decrease enterprise value by about a dollar (the pension size coefficient, on the other hand, suggests that a dollar decrease in pension liability will result in about a four dollar increase in enterprise value). While the deficit coefficient does not suggest the exact 1:1 ratio that logic would call for, it’s close enough for the difference to be explainable by estimation error.
Indeed, because pension size and pension deficit are highly correlated (we calculate it to be ~0.9), it seems to us that the first regression might simply be using a proxy variable of pension deficit, inadvertently or not. So really, the regression about pension size is just capturing the effect of pension deficits in an attempt to make a different, and in our opinion, dubious point. If there is a pension-related variable that affects the valuation of a company, then we think pension deficit is likely it.
1 Enterprise value = debt + market capitalization.
2 We are referring specifically to the proposition that, in the absence of taxes, capital structure does not affect a company’s valuation. Since pension liabilities can be thought of as deferred compensation, the tax benefits of pension contributions are offset by the forgone deduction from salaries paid, albeit with some potential timing differences.
3 Note the hint of sarcasm here. Modigliani and Miller won Nobel prizes in 1985 and 1990, respectively. In both cases, their work regarding the impact of capital structure on market valuation was noted by the Royal Swedish Academy of Sciences.
4 EBITDA Growth is used as the proxy for earnings growth, and is calculated by the average of EBITDA estimates for 2017, 2018, 2019 from Bloomberg vs. the 2016 EBITDA.
5 Long Term Growth is a dummy variable: 1 if the company is in the S&P Growth index, 0 if not.