While the COVID-19 crisis is certainly new for everyone, heightened volatility, a declining equity market, falling rates and widening credit spreads are not. So although funded status has fallen this time around, as compared to the Global Financial Crisis (GFC), plans have been better positioned to weather the storm.
The NISA PSRX index is structured to estimate the average funded status volatility of the top 100 U.S. corporate defined benefit plans.[1] Plans have de-risked materially since the GFC; equities allocations have decreased and hedge ratios have increased. At the end of March, the PSRX volatility level stood at 8.7%. By comparison, this index level as of 12/31/2008 was 19%. While market volatility was partially a driver of higher funded status volatility, a higher equity allocation also contributed to those levels.
The PSRX index uses asset allocations from company 10-Ks. As of fiscal year 2007, the last annual reporting period prior to the GFC, the average return-seeking asset allocation was 68%. As of fiscal year 2018, the return seeking asset allocation had fallen to 45%, nearly 20 percentage points lower than a decade ago! As a “What if experiment” we examined the 70 plans that were included in the PSRX during both the GFC and today. Those plans had an average funded status of 90% as of December 2019 and experienced a decline of 6 percentage points in funded status through March 2020. If those same plans had entered this crisis with their 2007 asset allocation, we estimate that funded status would have fallen by 12 percentage points or double the estimate of the actual deterioration!
As one would guess this indicates Funded Status Volatility (FSV) has materially declined across plan sponsors. Furthermore, the distribution of those funded status volatilities is materially different across plans. Using current market volatilities and plan funded statuses, but comparing 2007 allocations to current asset allocations, the average FSV reduction is 4.5 percentage points. Notably, only 4 plans (out of 70) experienced an increase in volatility.
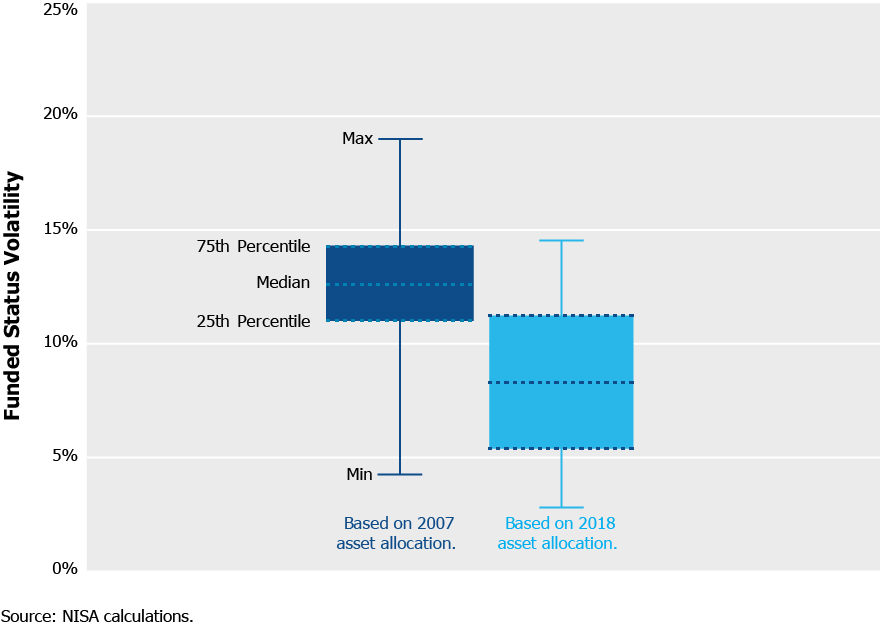
The increase in the spread of the distribution between 2007 allocation and today isn’t surprising. Prior to the GFC (and adoption of the Pension Protection Act of 2006 (PPA)), plan objectives, asset allocation and interest rate hedge strategies tended to be more similar. Now, depending on plan circumstances, an array of different factors drives asset allocation decisions and, accordingly, can lead to much different outcomes.
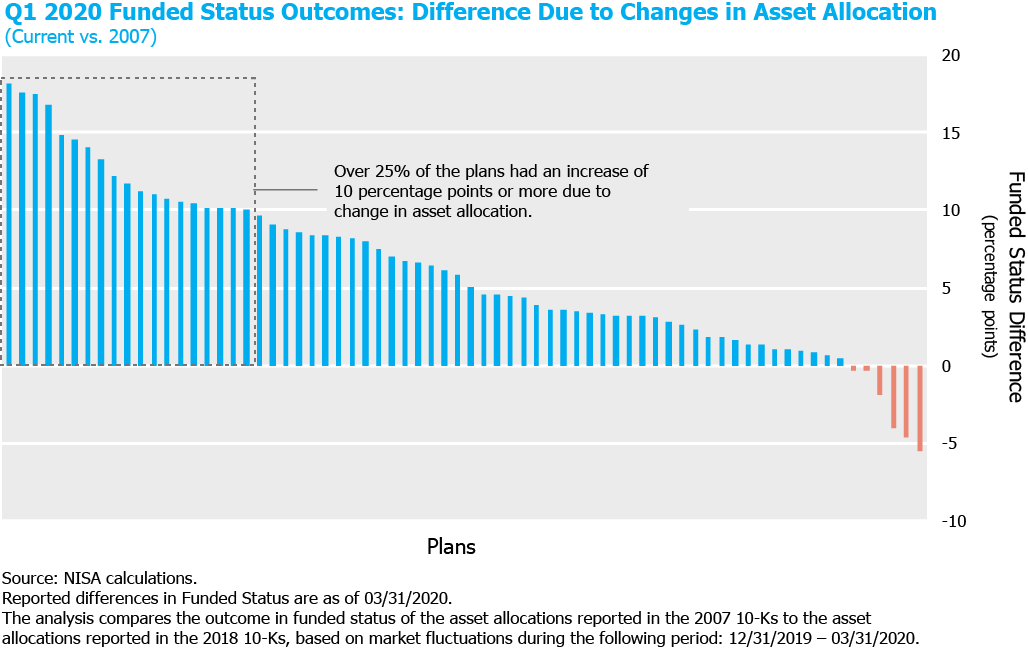
If we compare the performance of these plans during Q1-2020 based on their 2007 asset allocation, versus their 2018 asset allocation, over 90% of plans performed better based on their 2018 asset allocation. For more than 25% of plans, the change in asset allocation resulted in an improvement in funded status by over 10 percentage points year to date. (By improvement, we mean less negative outcome in funded status.) When put in context of the size of the 70 liabilities, this translates to an additional $71b in funded status versus the outcome using 2008 asset allocations.
While a plan sponsor can’t control the market, they can control asset allocation. It is evident from these results that actions taken by sponsors over the past decade prepared their plans for the crisis and put them in a better position to weather a market downturn.
Originally published on May 4, 2020. Revised on May 14, 2020.
[1] Data taken from NISA’s PSRX® Index Data which is based on the 100 largest pension plans, as determined by NISA based on publicly available information. The PSRX Index is a forward-looking estimate of the funded status volatility of U.S. corporate defined benefit pension plans. Asset allocation data is collected annually on the largest U.S. corporate pension plans. Keep in mind the PSRX uses generic assumptions based upon data only available in plan sponsors 10-Ks. Specific fixed income allocations, use of overlay strategies, and alternative asset allocations can drive differences. The levels for the PSRX, sector indices and Pension Risk Calculator include data for periods prior to when the index was in live production. Historical levels for the index prior to live production in September 2012 are calculated using the same methodology. Past market experience is not necessarily indicative of future market experience.
For more information on the PSRX Index go to: www.nisa.com/resources/psrx.