
Economic and Market Overview
April 2026
Equities rose, Treasuries sold off, and credit spreads tightened despite the lack of any apparent resolution to the conflict in the Middle East. The month concluded with plenty of intrigue surrounding Jerome Powell’s final FOMC meeting as Chairman.
Markets
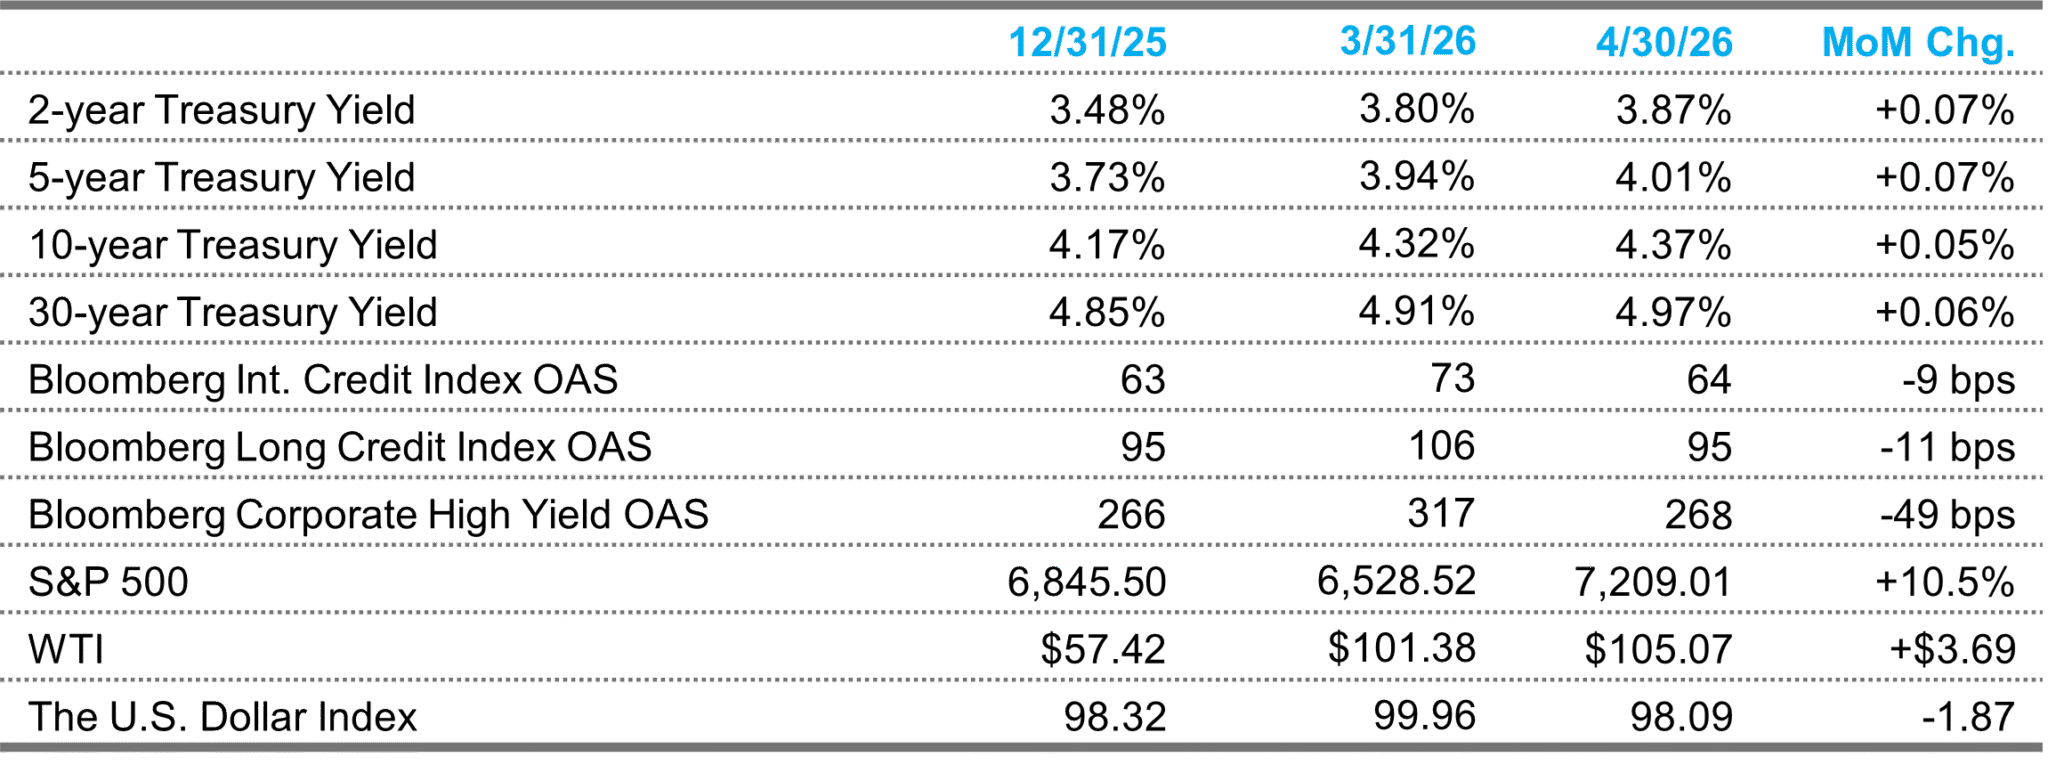
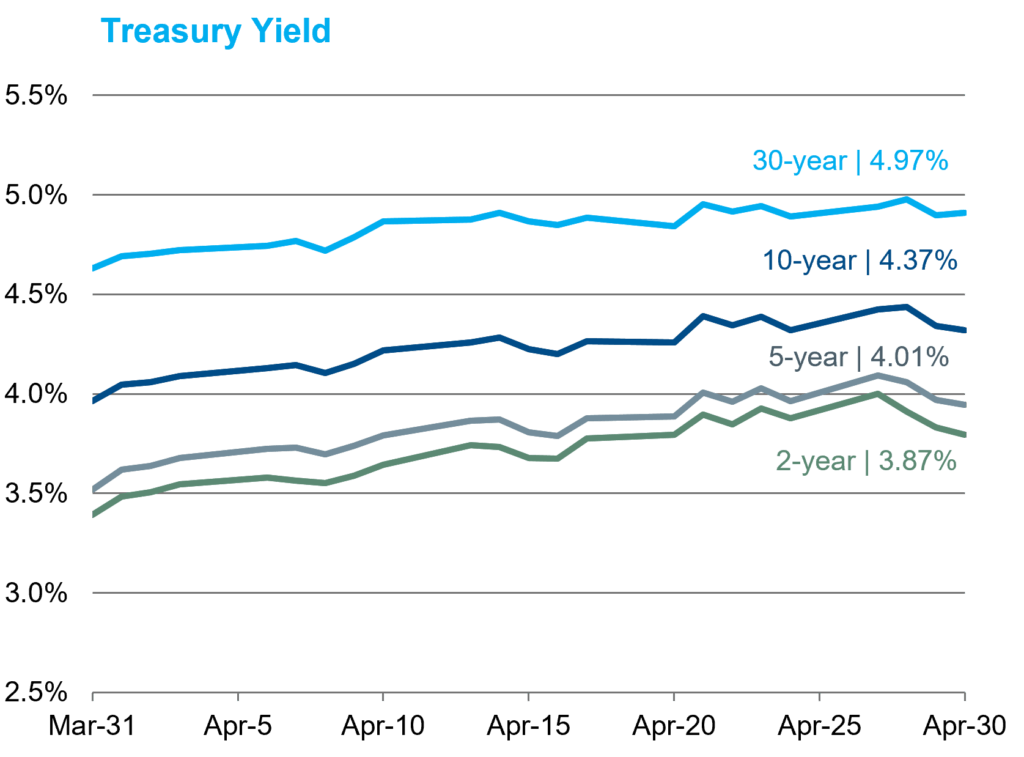
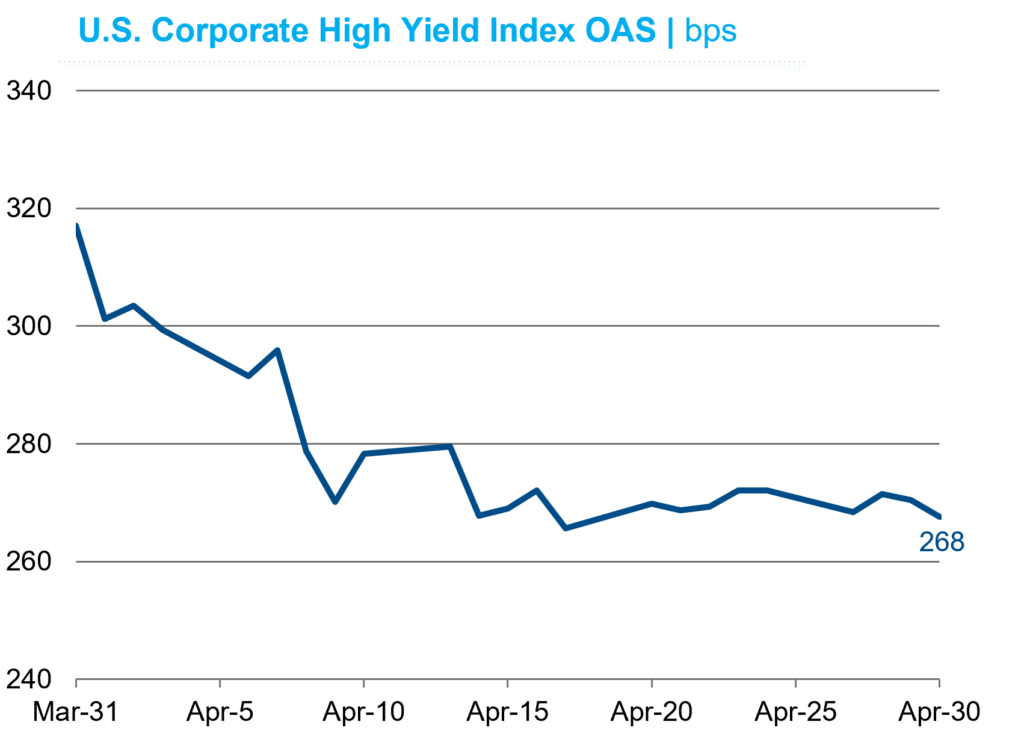
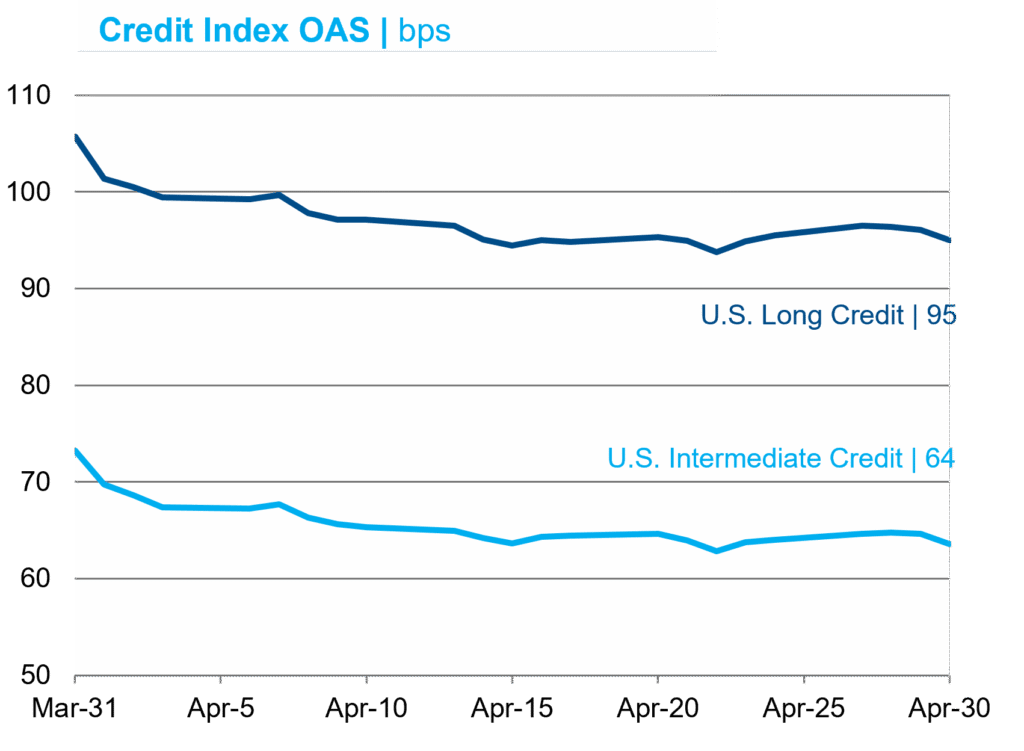
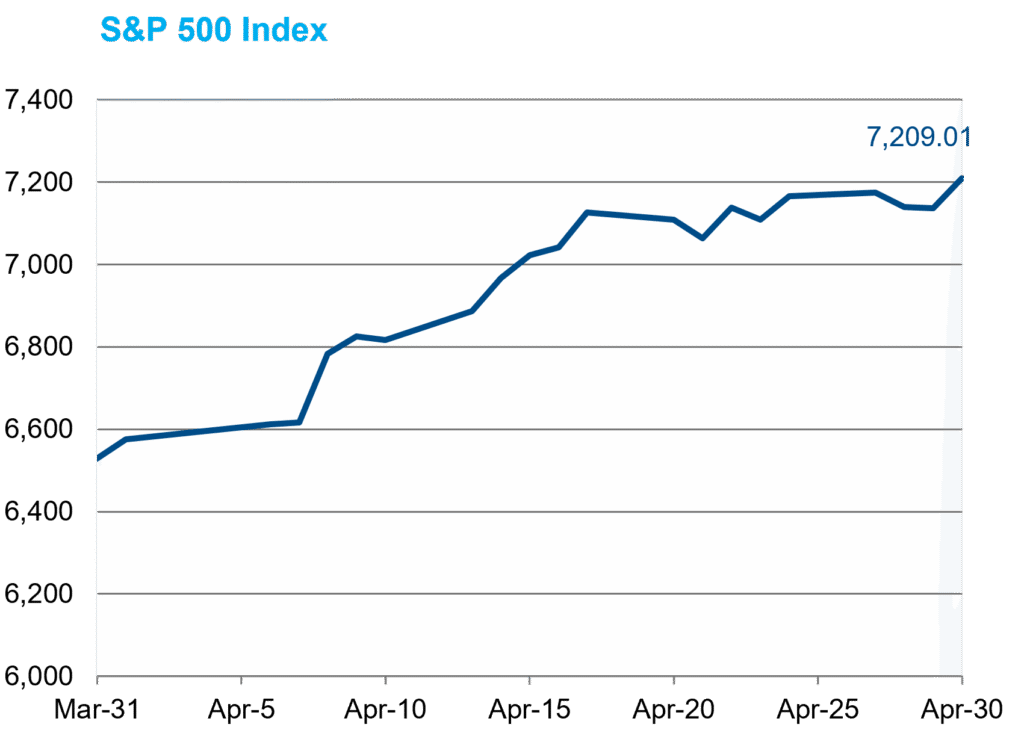
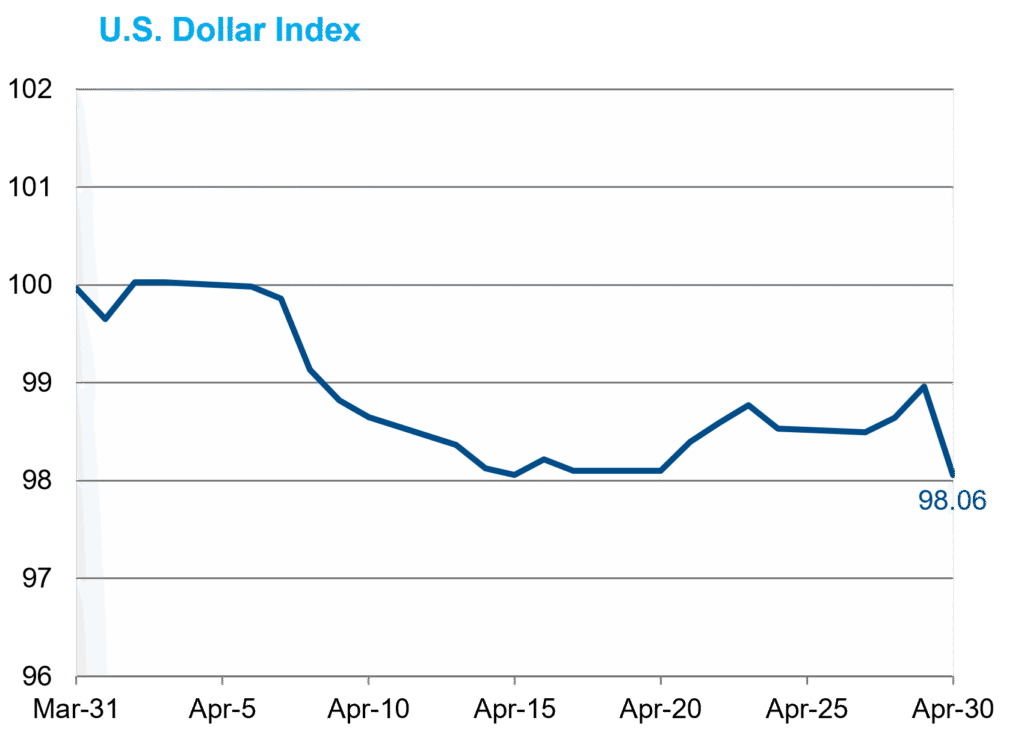
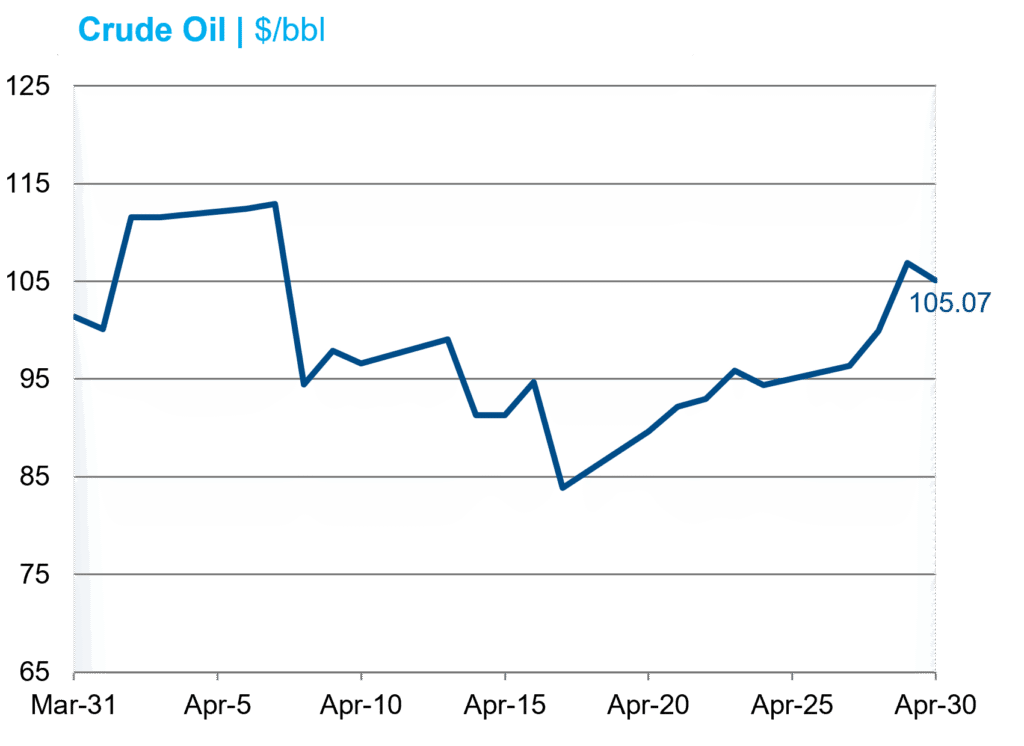
Stocks climbed steadily over the month as earlier hopes for a resolution to the war in Iran gave way to strong corporate earnings results. The S&P 500 ultimately returned 10.5% with only five days in the red, while the Russell 2000 fared even better, gaining 12.3%. Treasuries sold off for the second straight month, though this time the shift was effectively parallel, and yields rose by just mid-single digits. Credit spreads tightened early in the month and then were largely rangebound as the risk-on tone confronted heavy supply. J.P. Morgan reported $184 billion in investment-grade issuance, 92% over the average of the trailing four Aprils, and $44 of high-yield issuance, a seven-month high. WTI fluctuated with the outlook for the conflict in the Middle East, topping $110/bbl early and late in the month and falling below $85/bbl in between. Hawkish releases from central banks abroad and a warning from Fitch that the U.S.’s AA+ rating faced challenges from its growing debt burden sent the Dollar Index 1.9% lower while gold fell 1.1%.
Economic Data
Nonfarm payrolls growth rebounded to a 178k pace in March, 112k beyond the median estimate, likely due in part to a rebound from February distortions from nursing strikes and weather. The unemployment rate also surprised with a 0.1% dip to 4.3%. The release only included a 41k downgrade in February’s NFP pace (to -133k), though the net reduction for the prior two months was just -7k. Looking ahead, economists expect a 60k gain in April nonfarm payrolls and no change in the unemployment rate when data are released on May 8. Retail sales easily beat in March, even as February’s numbers were revised higher. Consumer sentiment indices were mixed again as the Conference Board reported an increase from March, while the University of Michigan’s Index hit its lowest level in the measure’s nearly 50-year history. Housing releases are still playing catch-up, but those that were announced in April were mixed again. Likewise, hard and soft data in manufacturing and services remained noisy. U.S. GDP followed a 0.5% Q4 decline with a +2.0% pace in Q1, according to the advance release, though this fell 0.3% short of forecasts. Consumers weren’t to blame, however, as personal consumption surprised 0.2% to the upside by rising at a 1.6% annualized pace.
Inflation
Higher energy prices contributed to a 0.6% MoM jump in headline CPI to 0.9% in March, in line with expectations. In fact, the energy component’s 10.9% increase was the second-highest on record. The core index, on the other hand, rose by just 0.2% and was the coolest print since last May. PPI releases also came in well under consensus. As with CPI, headline MoM PCE jumped (0.4% to 0.7%), but the core figure’s 0.2% MoM pace was 0.1% under forecasts. 2-year inflation expectations fell over the month, but breakevens 5-years and longer climbed. The 10-year break led the way, finishing up 18 bps at 2.49%.
Federal Reserve
In what was likely the final meeting under Chairman Powell’s leadership, the FOMC left their policy rate unchanged. Four voters dissented from the decision, the most since October 1992. One dissent was dovish, and the other three hawkish dissents only opposed the inclusion of an easing bias in the FOMC Statement language. Once he is confirmed, incoming Chairman Warsh will preside over a Committee that is increasingly divided by the stagflationary effects of the energy price shock. Powell announced that he will remain on as a Governor after his term as Chairman ends on May 15, bucking 80 years of precedent in order to defend the Fed’s independence against the series of unprecedented legal attacks by the Trump administration.
Sources: Bloomberg Index Services Ltd., Bloomberg.
This overview is for informational purposes only. The information has been obtained from sources considered to be reliable, but the accuracy and completeness are not guaranteed. There is no assurance that any economic trends mentioned will continue or that any forecasts will occur. Economic data are as of the dates noted.
Disclosure Information
By accepting this material, you acknowledge, understand and accept the following:
This material has been prepared by NISA Investment Advisors, LLC (“NISA”). This material is subject to change without notice. This document is for information and illustrative purposes only. It is not, and should not be regarded as “investment advice” or as a “recommendation” regarding a course of action, including without limitation as those terms are used in any applicable law or regulation. This information is provided with the understanding that with respect to the material provided herein (i) NISA is not acting in a fiduciary or advisory capacity under any contract with you, or any applicable law or regulation, (ii) that you will make your own independent decision with respect to any course of action in connection herewith, as to whether such course of action is appropriate or proper based on your own judgment and your specific circumstances and objectives, (iii) that you are capable of understanding and assessing the merits of a course of action and evaluating investment risks independently, and (iv) to the extent you are acting with respect to an ERISA plan, you are deemed to represent to NISA that you qualify and shall be treated as an independent fiduciary for purposes of applicable regulation. NISA does not purport to and does not, in any fashion, provide tax, accounting, actuarial, recordkeeping, legal, broker/dealer or any related services. You should consult your advisors with respect to these areas and the material presented herein. You may not rely on the material contained herein. NISA shall not have any liability for any damages of any kind whatsoever relating to this material. No part of this document may be reproduced in any manner, in whole or in part, without the written permission of NISA except for your internal use. This material is being provided to you at no cost and any fees paid by you to NISA are solely for the provision of investment management services pursuant to a written agreement. All of the foregoing statements apply regardless of (i) whether you now currently or may in the future become a client of NISA and (ii) the terms contained in any applicable investment management agreement or similar contract between you and NISA.