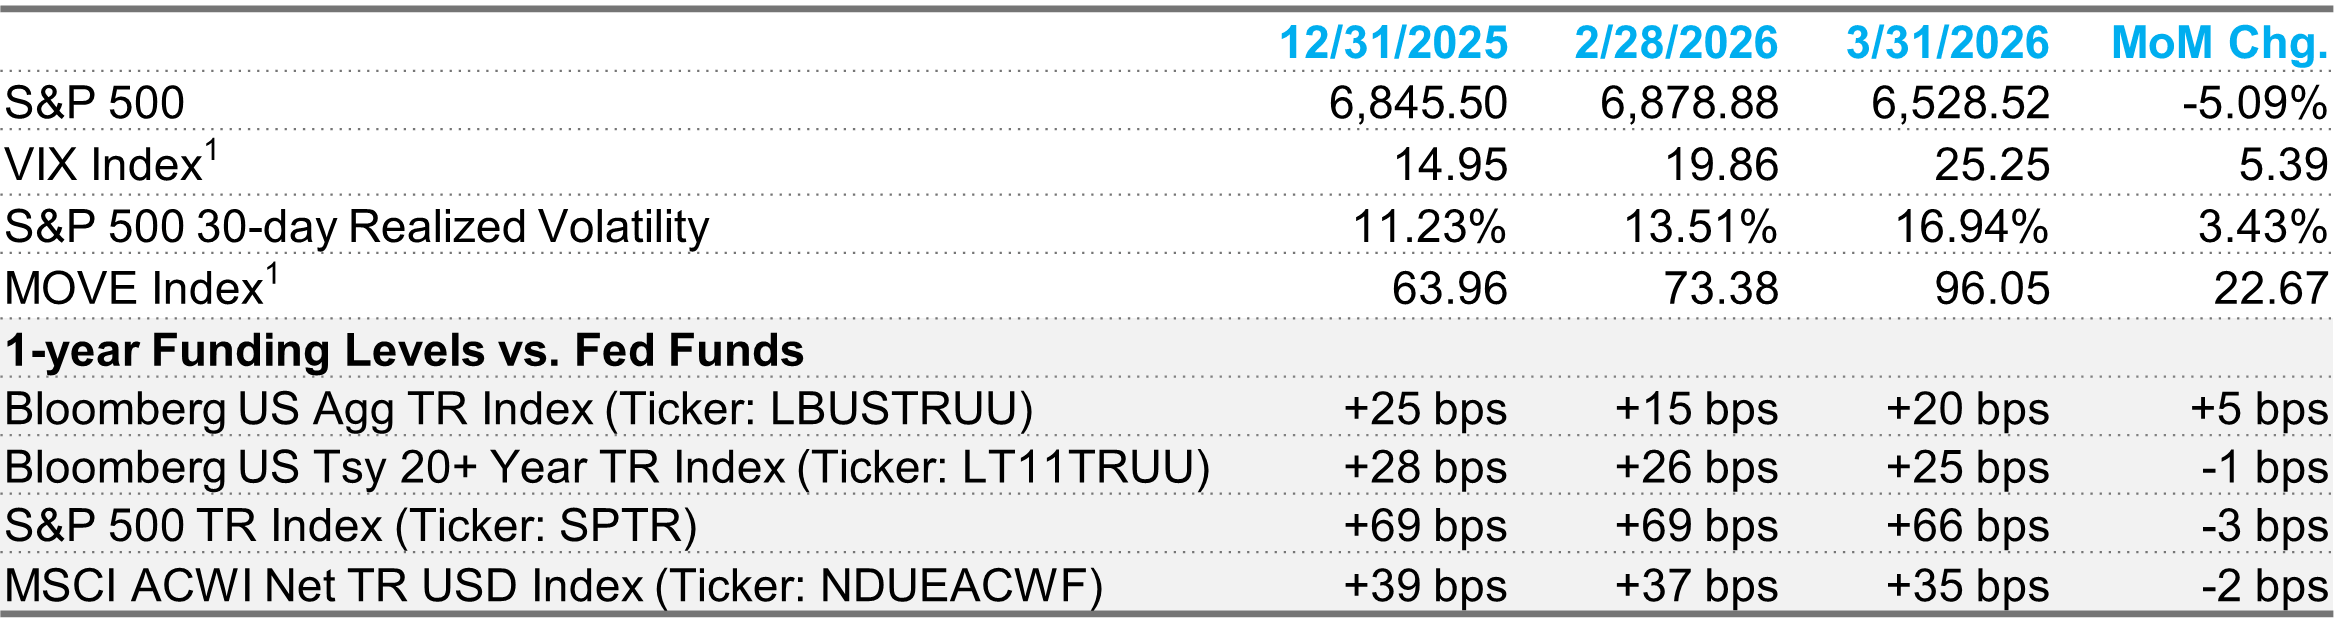
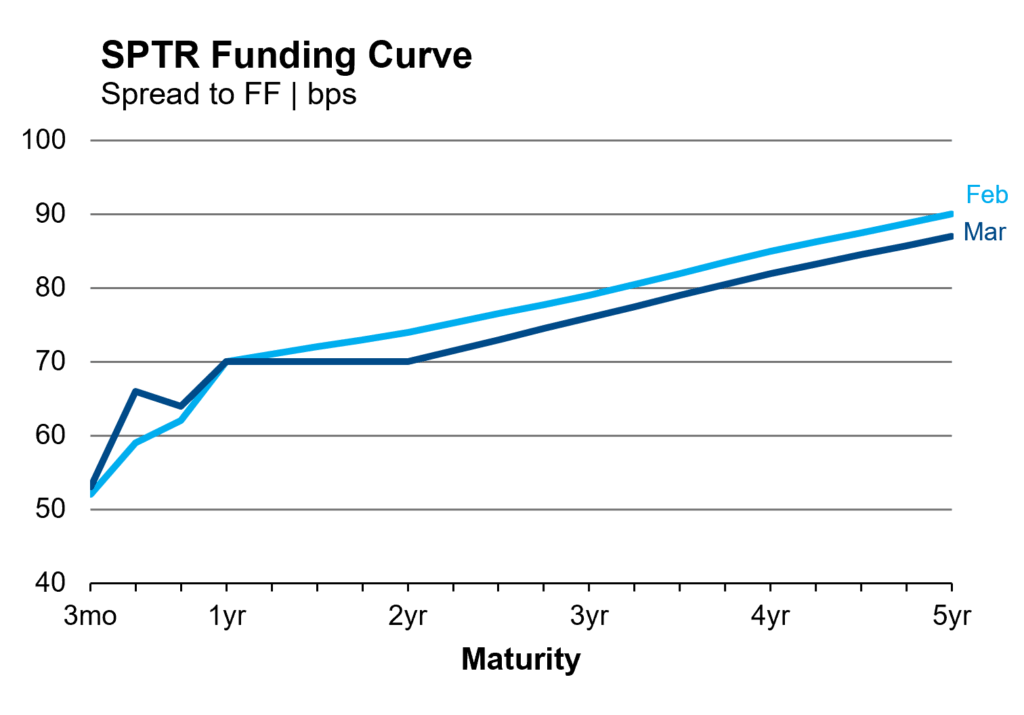
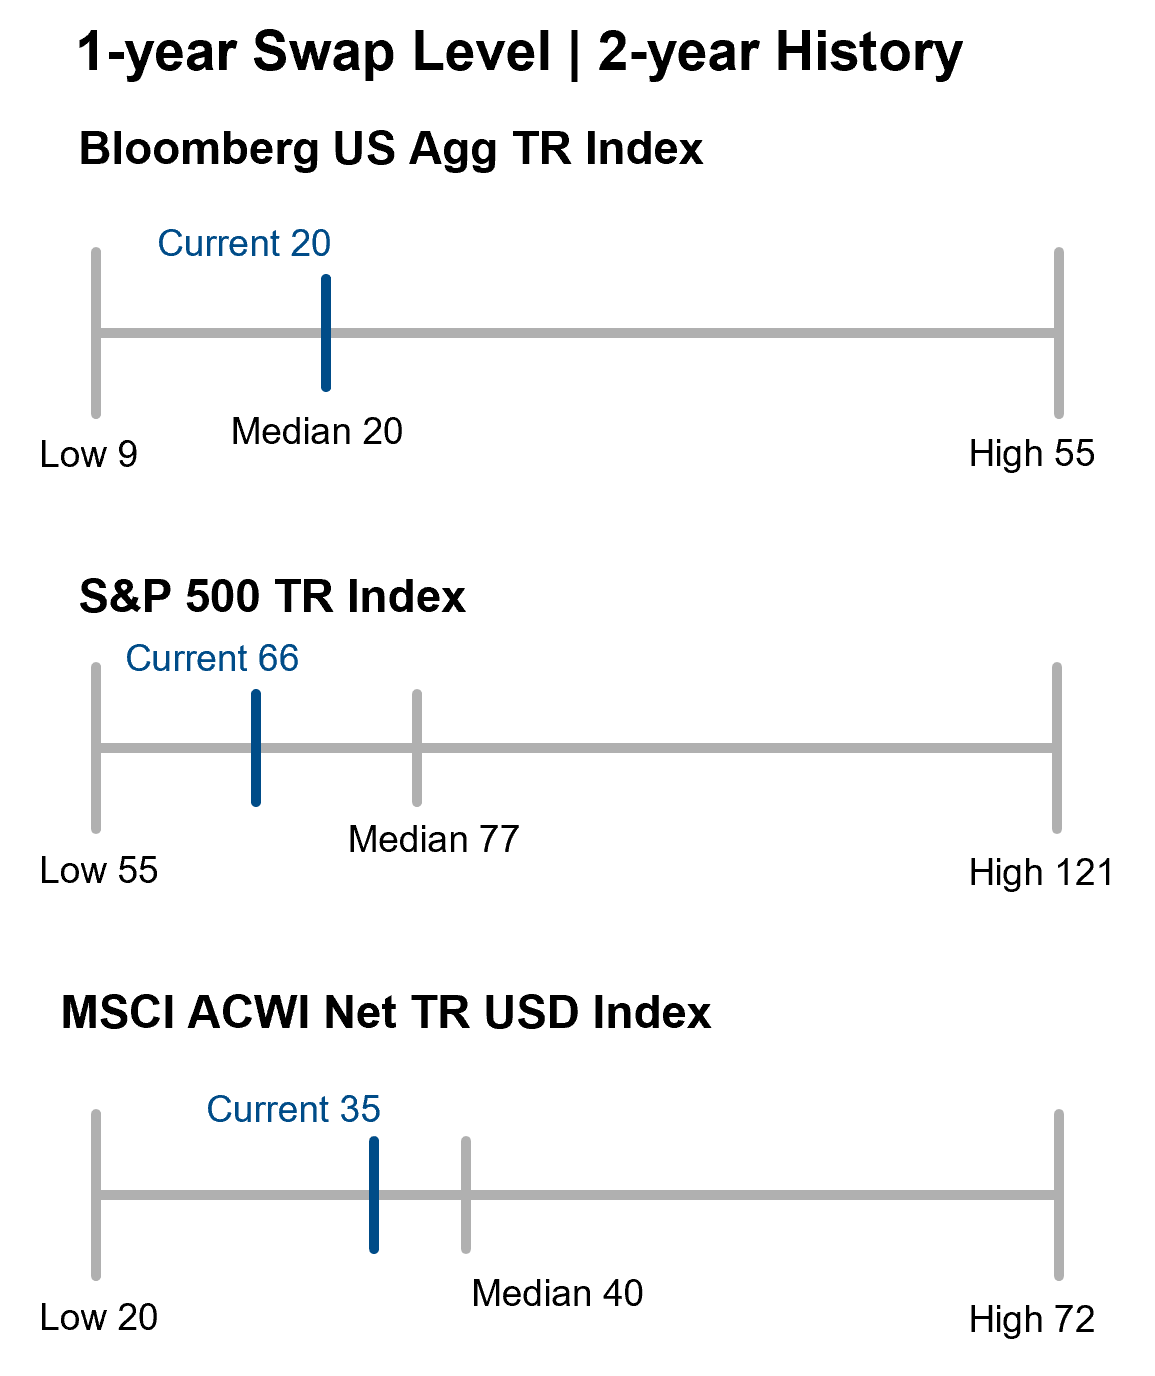
Financing costs were largely stable in the one-year tenor, except for the US Agg Index, which moved 5 bps higher. One-year funding levels continue to trade below the median of the prior two years across equity and fixed income markets. The equity funding term structure flattened in March, driven by a slight move lower at the longer end of the curve.
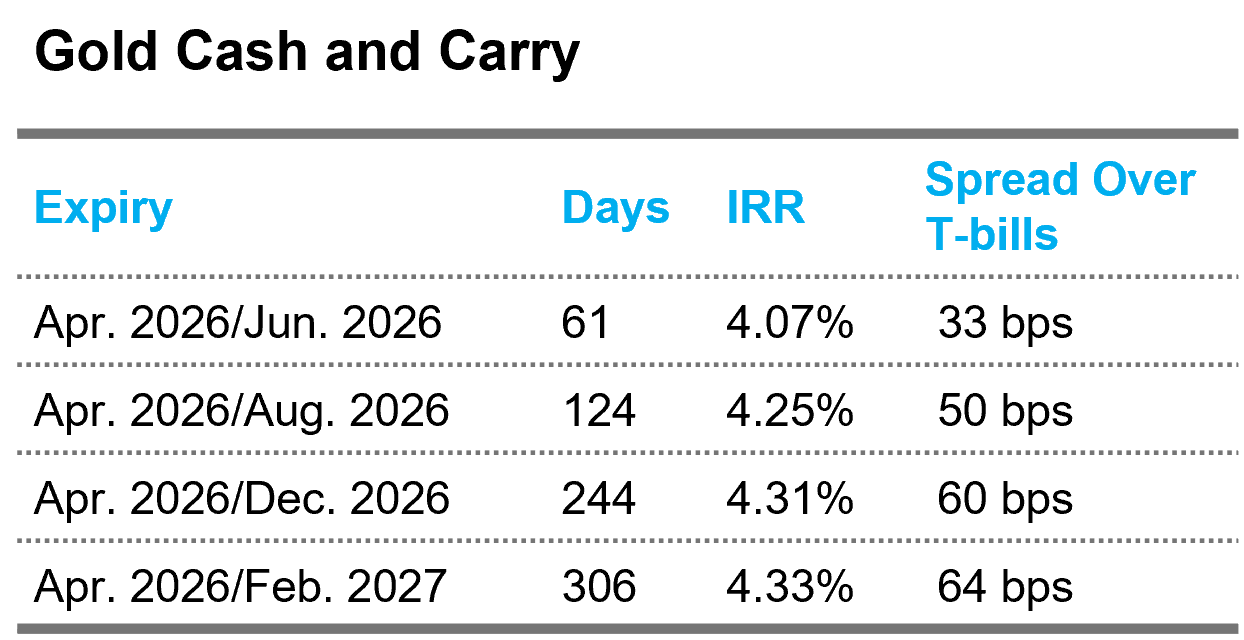
Cash-and-carry strategies seek to earn a positive financing spread after adjusting for carrying costs. The strategy buys a near-dated futures contract (e.g., April 2026) with the intent of taking delivery of the physical asset and sells a far-dated futures contract. The financing levels in the table account for the storage costs associated with taking physical delivery of gold.
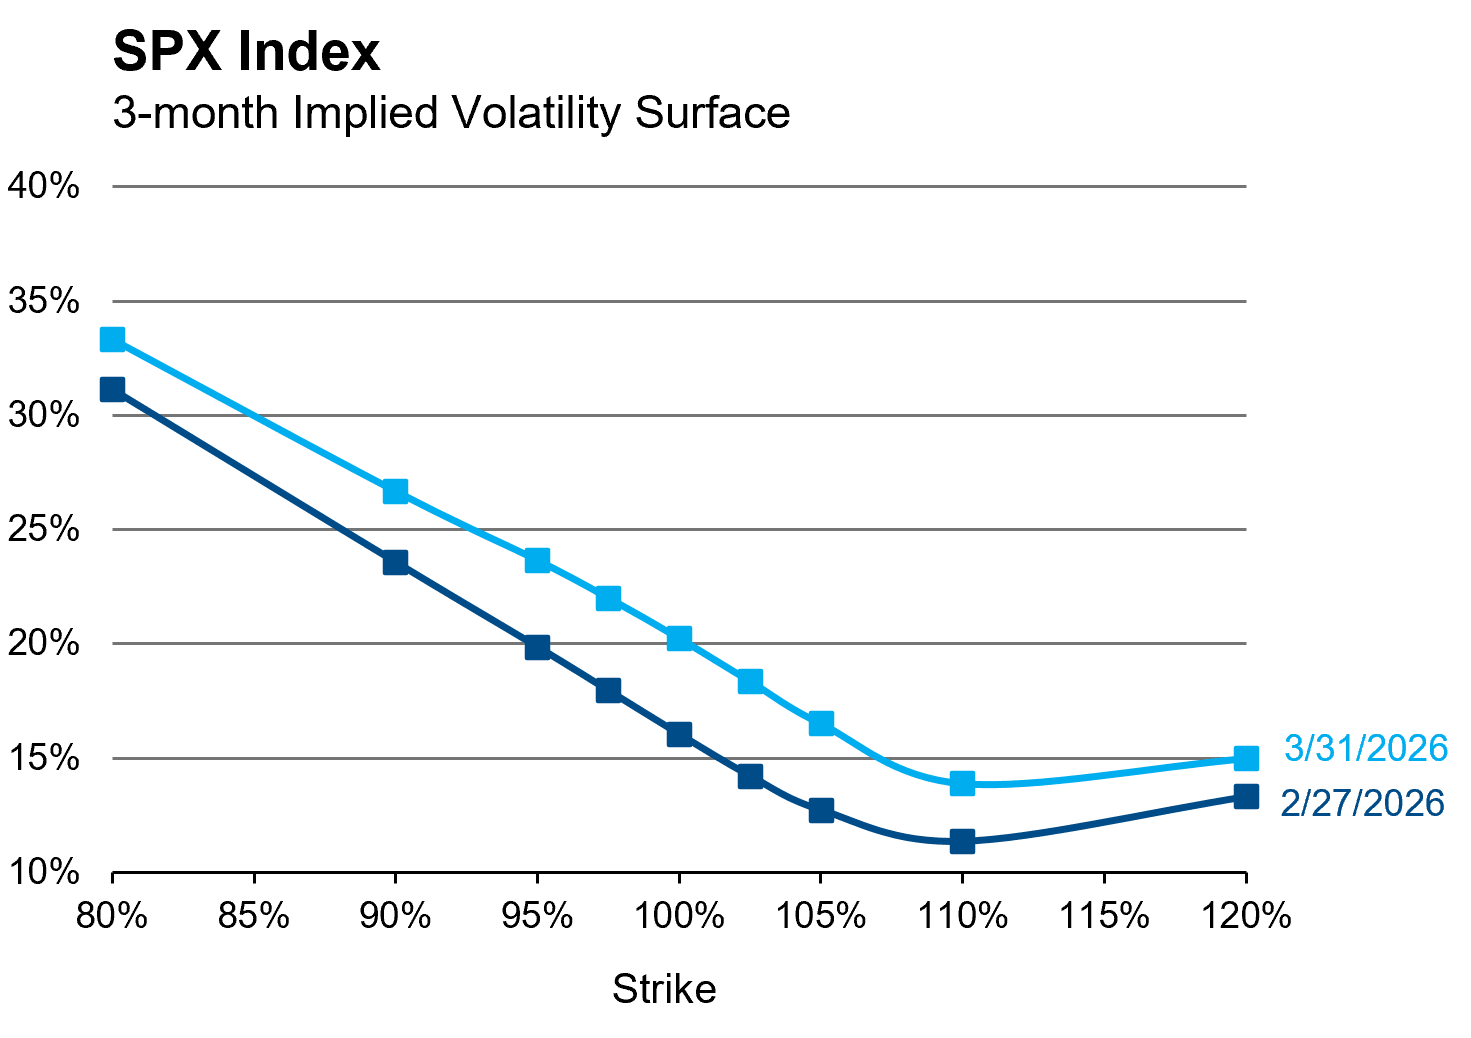
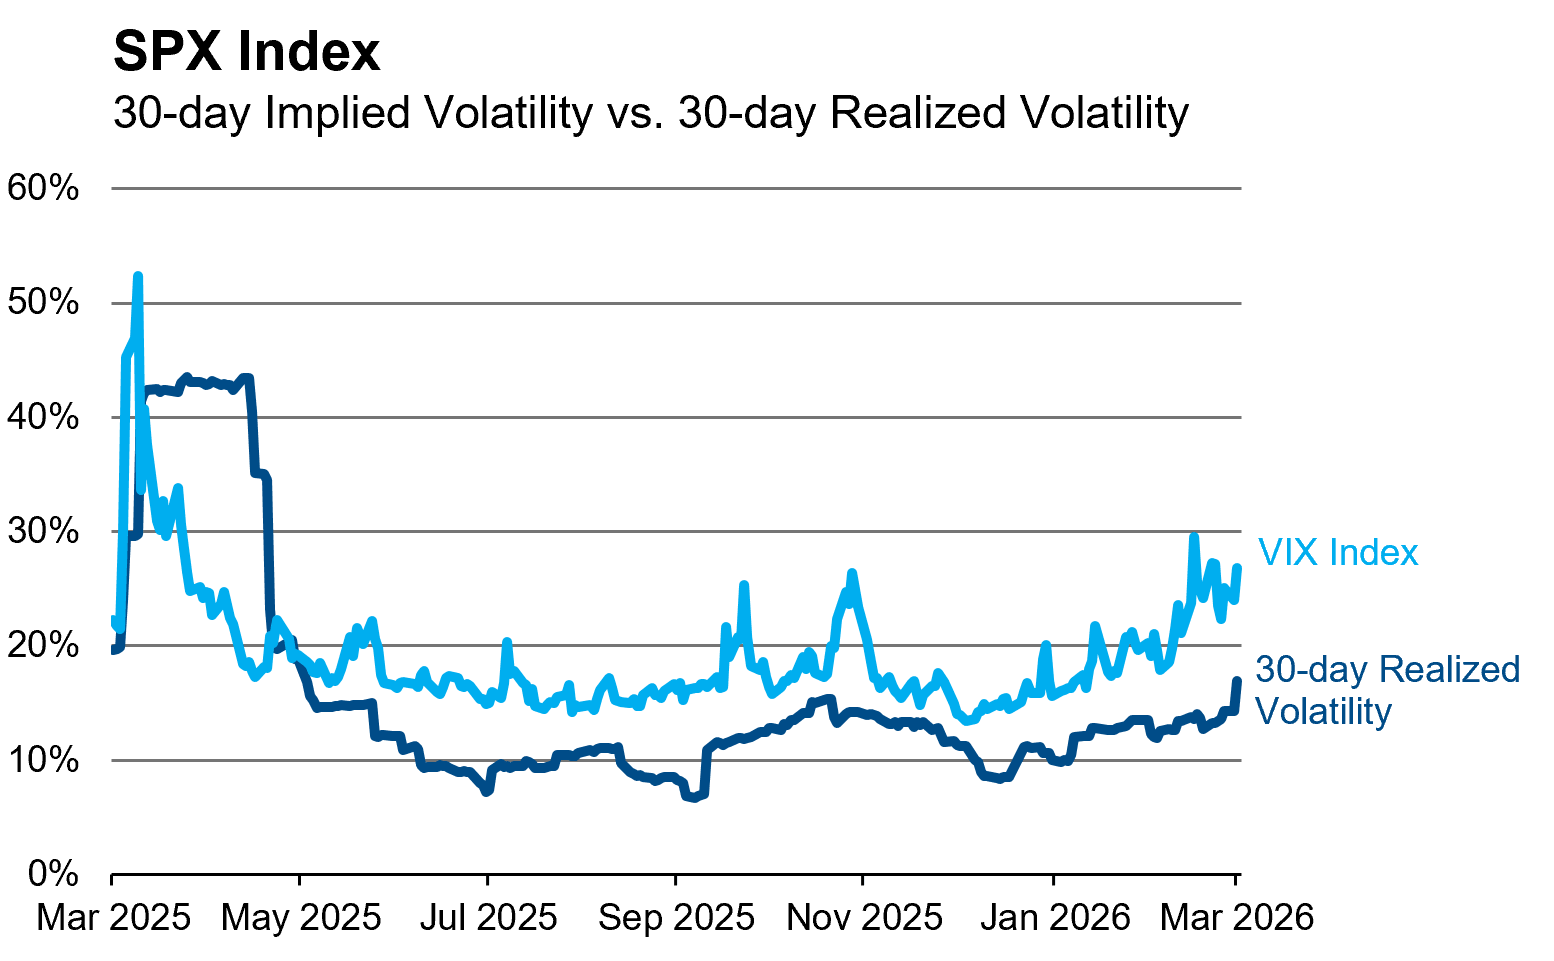
With the advent of the Iran war and the resulting move in global energy prices, implied volatilities across asset classes moved aggressively higher. The SPX implied volatility surface made a parallel shift higher with slightly more outsized moves around the ATM strikes. While implied volatilities were highly reactive (VIX reached an intraday high of 35.30), realized volatility was more muted, with 30-day realized volatility at 16.9% putting the realized/implied volatility spread in the 82nd percentile on a two-year lookback. Outside of the last day of the month, close-to-close mean reversion was prevalent, dampening realized volatility. Interestingly, 2.7 points of realized volatility were attributable to the 2.9% rally on March 31.
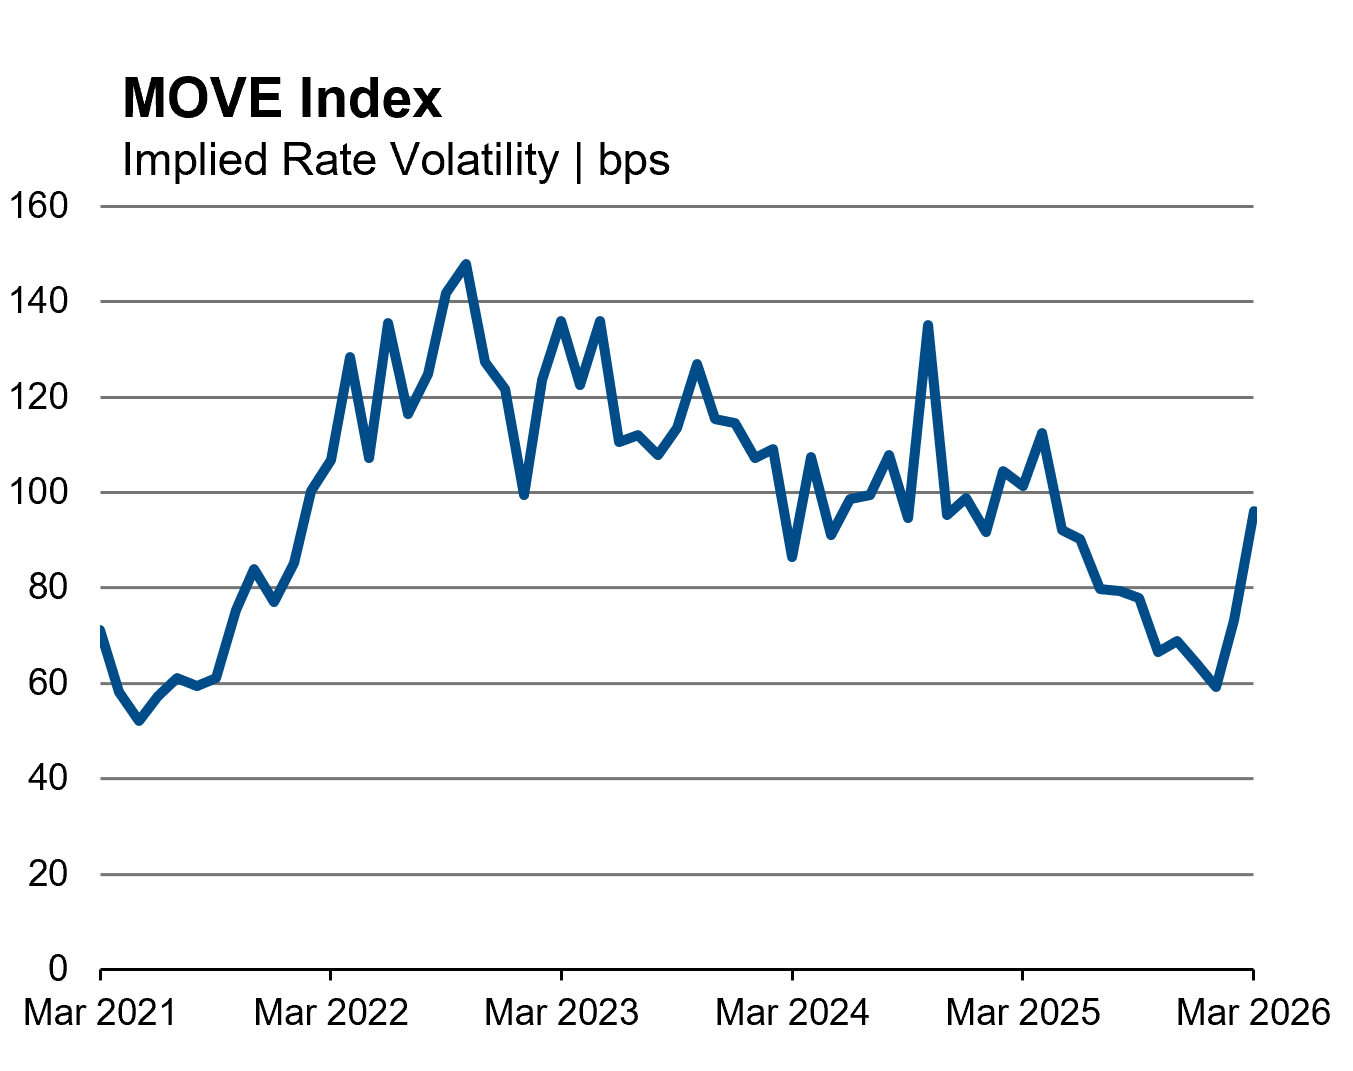
The large move in oil prices had knock-on effects on U.S. interest rate volatility as markets priced higher near-term inflation expectations. Interest rates moved wildly, with the 10-year UST yield increasing 38 bps on the month. The MOVE Index, a measure of implied volatility in U.S. Treasury markets, had been declining since “Liberation Day” but gained 23 bps in March, its largest one-month increase since October 2024. While the MOVE Index applies the largest weight to the 10-year interest rate, shorter-dated swaption implied volatilities showed even greater signs of stress, with the 1Mx2Y USD swaption [1] volatility more than doubling in March.
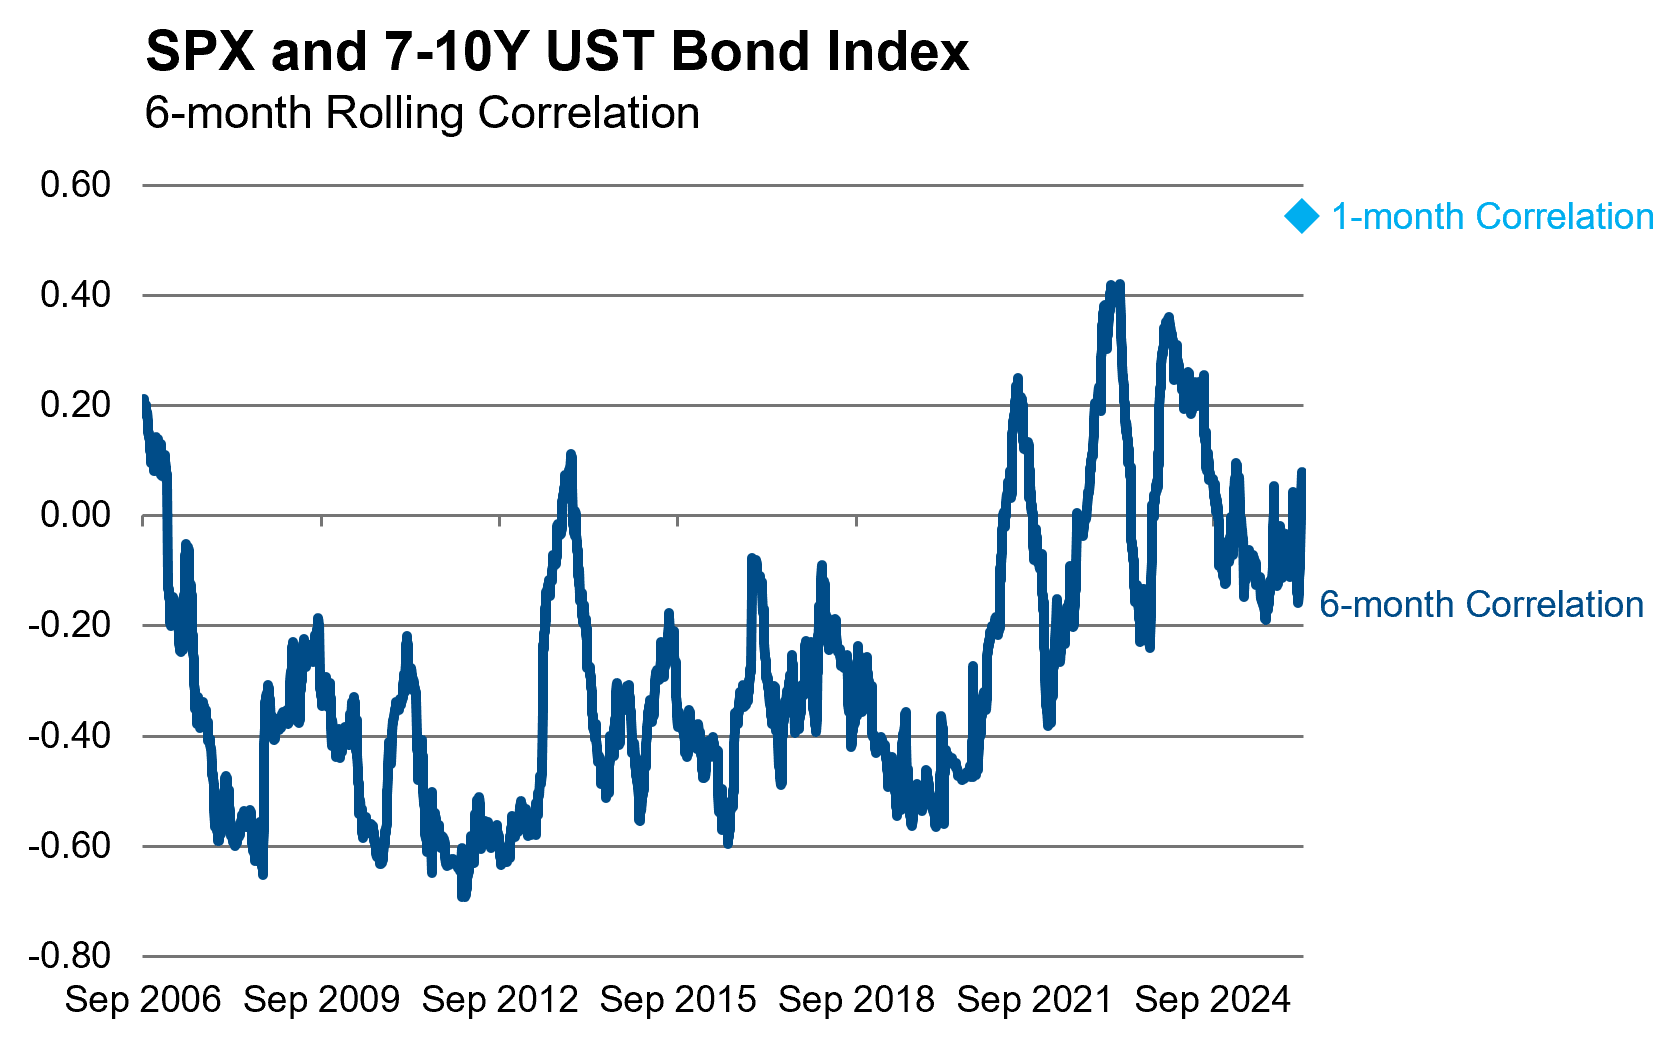
With global equity markets declining, interest rates rising, and gold underperforming, March laid bare the necessity for varied portfolio hedges. The historically negative correlation between U.S. bond and equity prices broke down materially in March, with a one-month realized correlation of 0.54, contrasted to the current six-month correlation of 0.08. A traditional 60/40 portfolio[1] would have returned -4% for March, its worst one-month performance since September 2023.
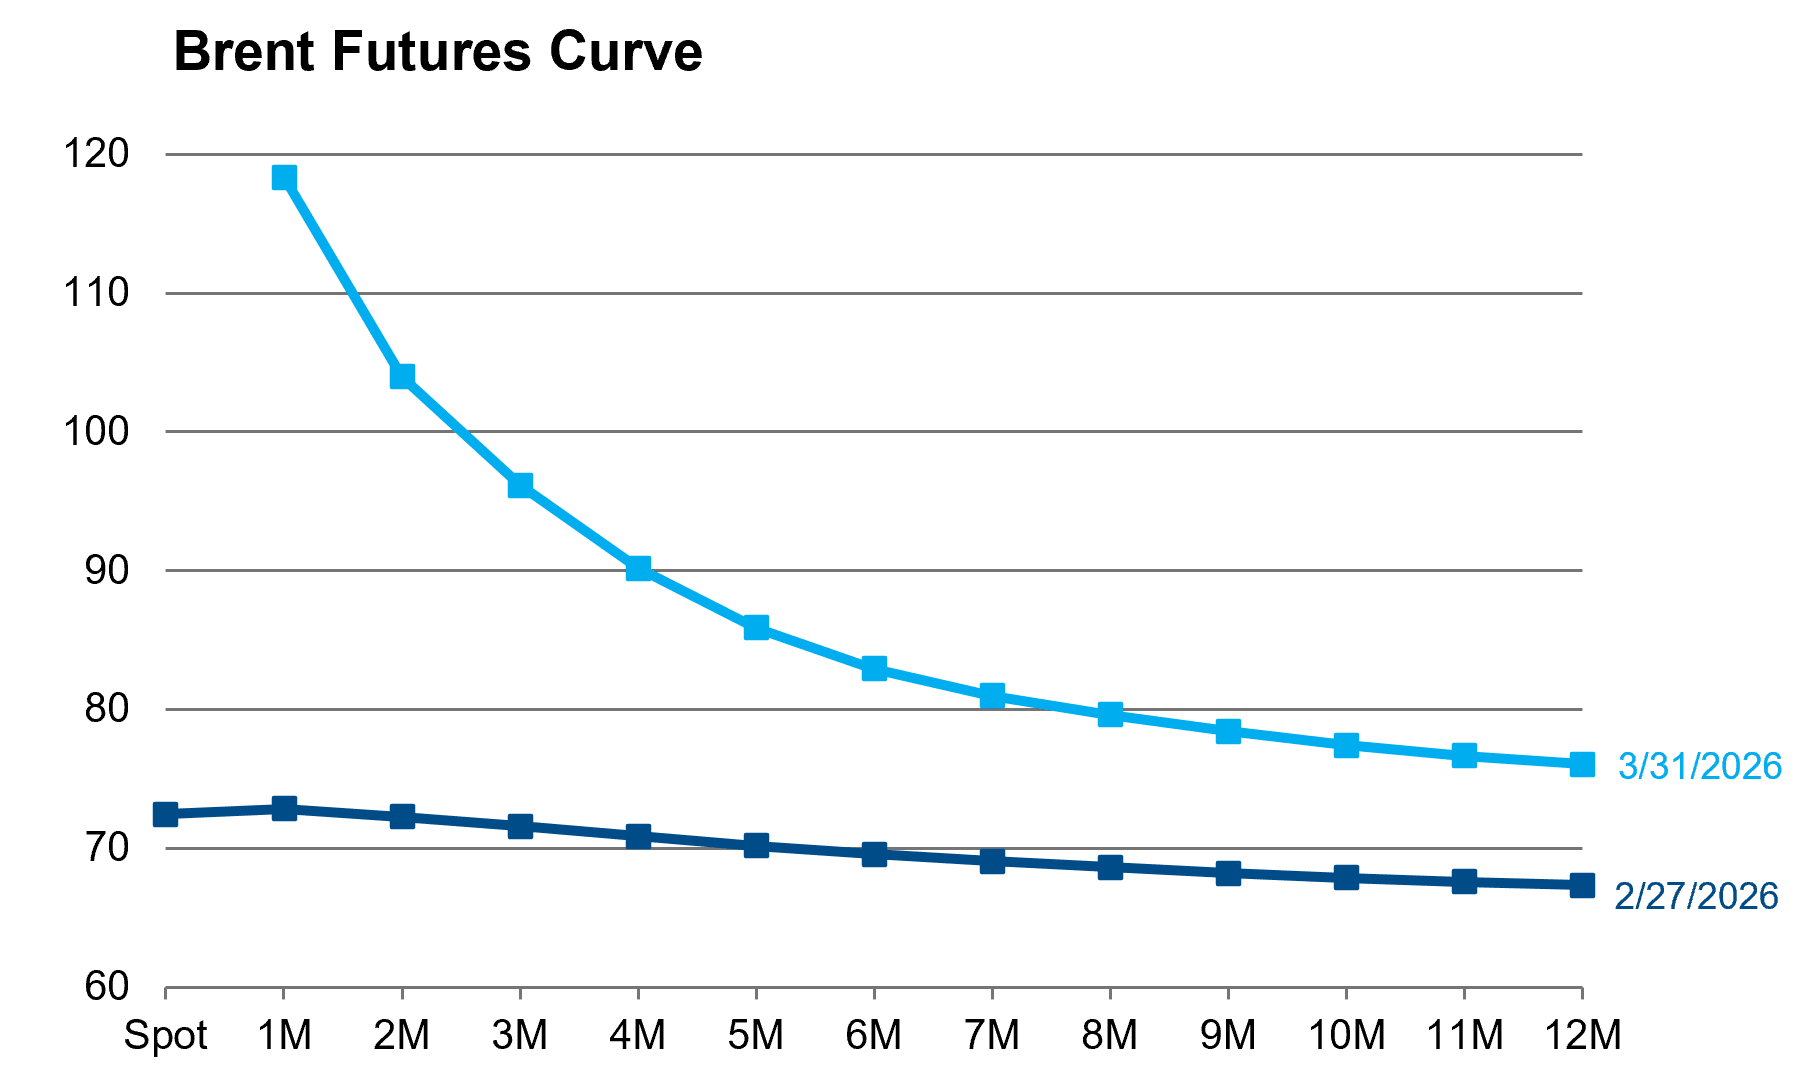
With Brent oil prices increasing 63%, crude oil was the dominant story in March. The futures curve inverted, with near-dated futures contracts trading at a significant premium to longer-dated contracts. The beta of the six-month futures contract to the front month contract was 0.5 in March, contrasted to a five-year average of 0.8, as contracts further out the curve were less reactive to spot oil prices than observed historically. Given the steep inversion of the futures curve, the market is indicating a relatively quick resolution to high oil prices.
Implied volatility also increased with one-month ATM volatility reaching a five-year high of 106%. An implied volatility of this level means markets were pricing oil to move $6.60 per day. To put it into context, the average one-month implied volatility of Brent oil for the last year was 36%, or a move of $1.55 per day.