
Economic and Market Overview
May 2026
The equity rally persisted, credit spreads tightened and the price of oil tumbled, as markets leaned into hopes for a deal with Iran. In Treasuries, the front end led yields higher, as CPI exceeded expectations and Kevin Warsh replaced Jerome Powell as Fed Chairman.
Markets
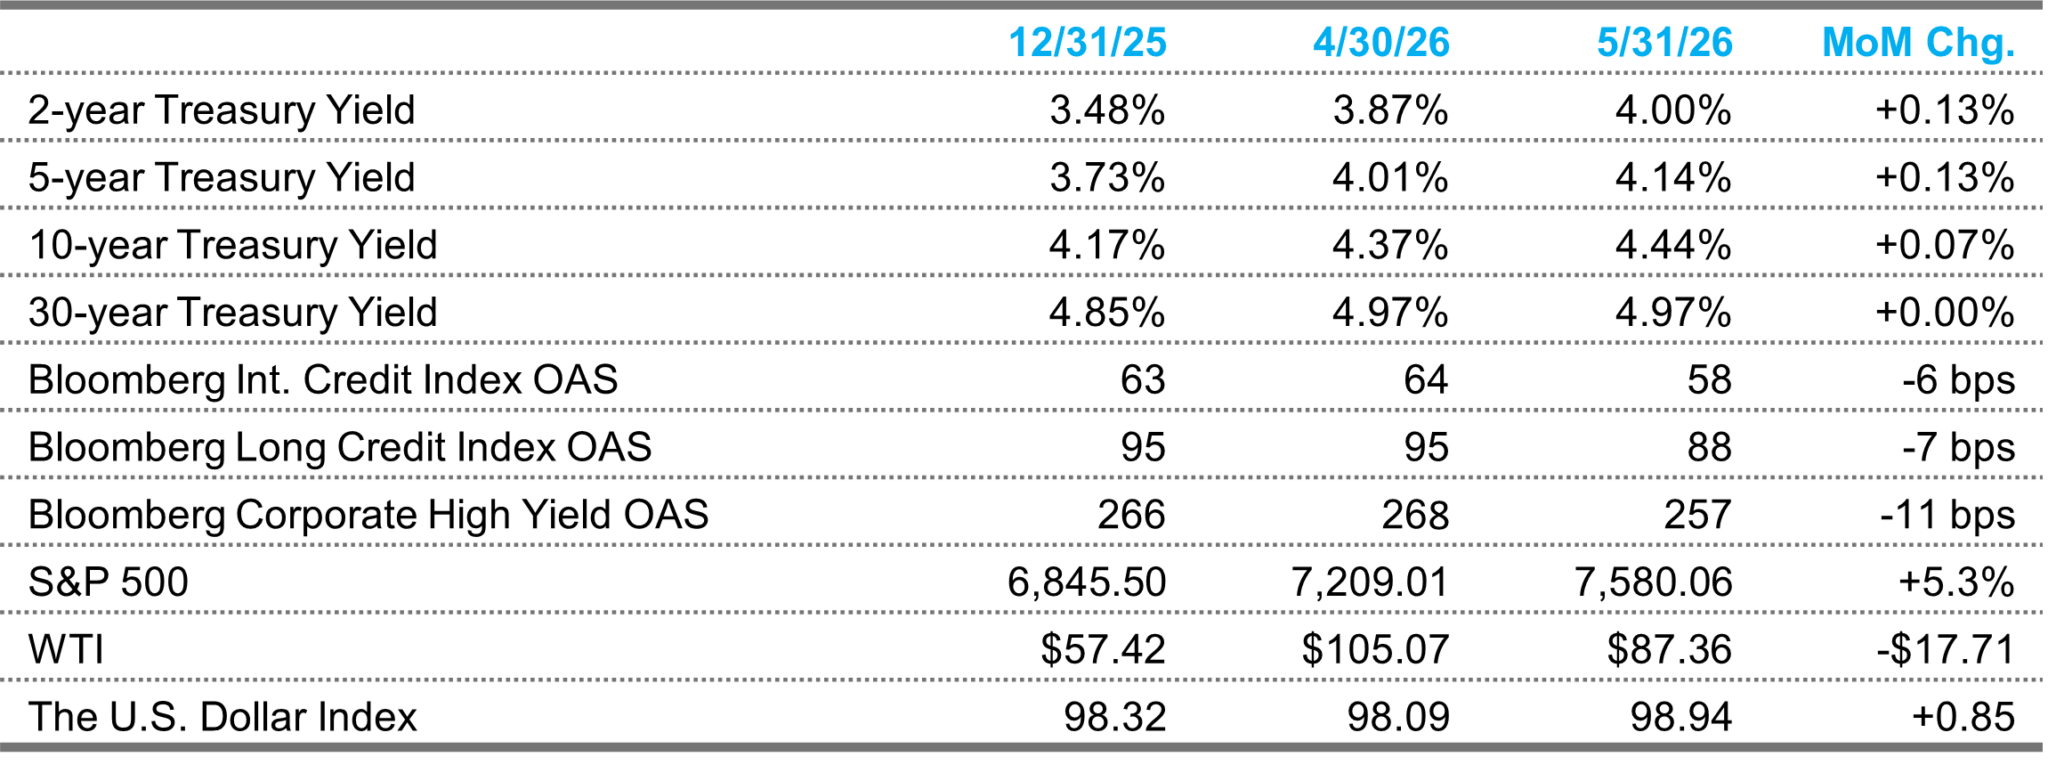
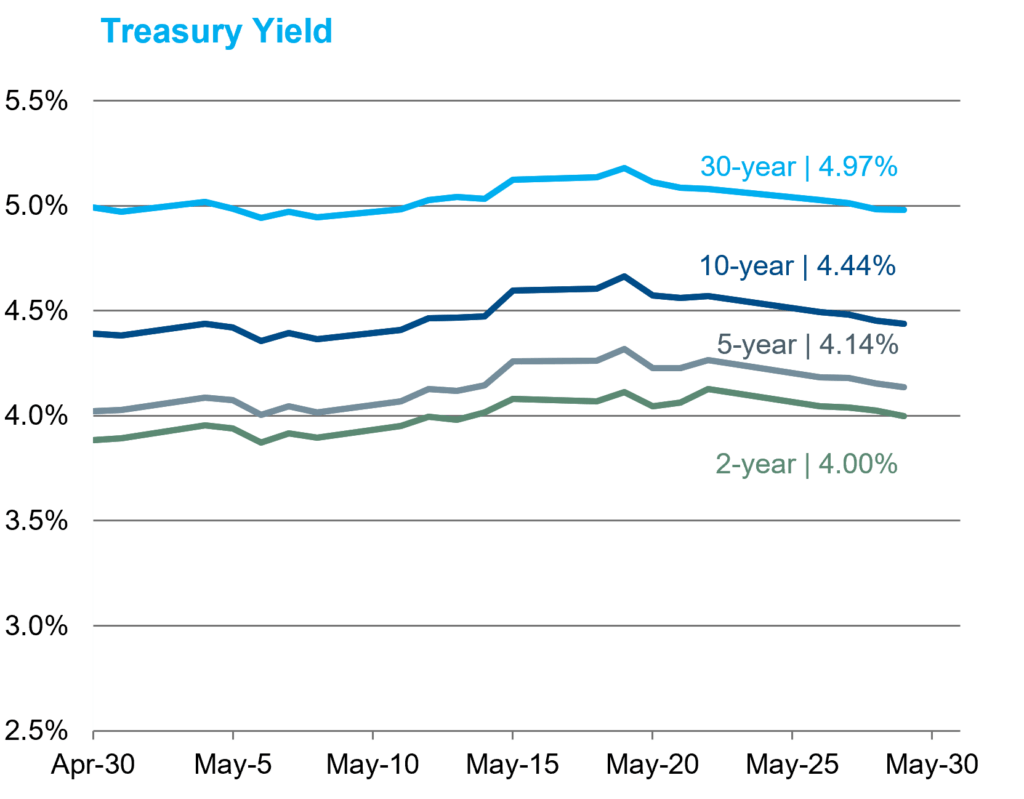
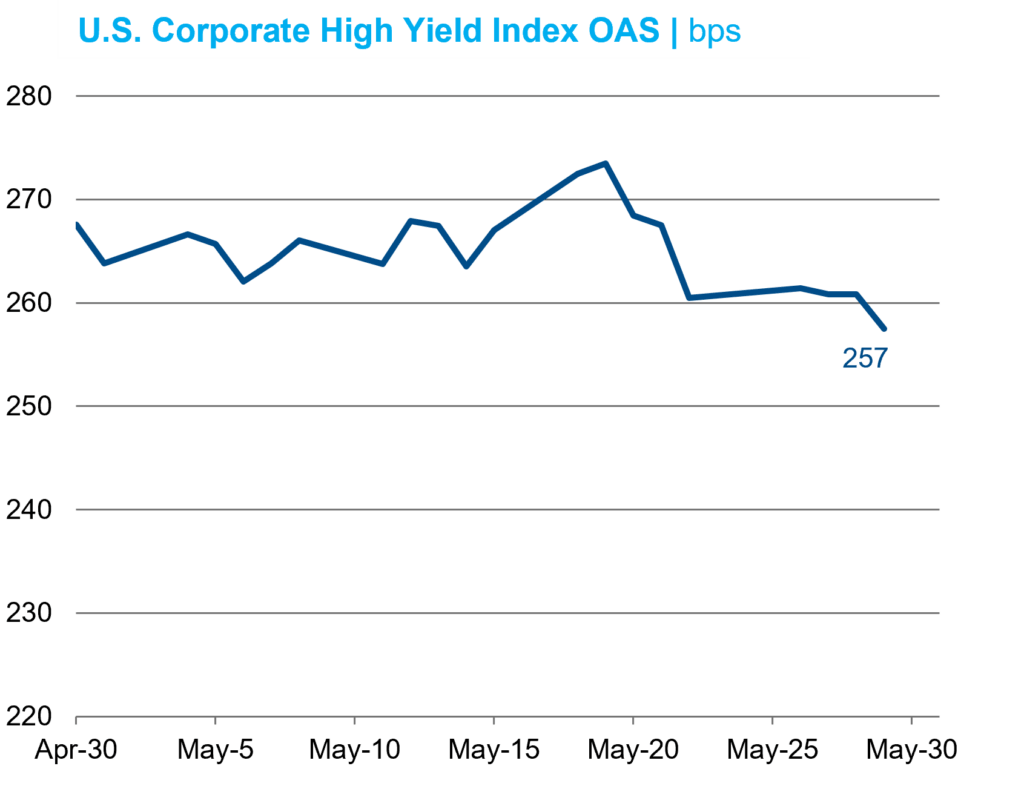
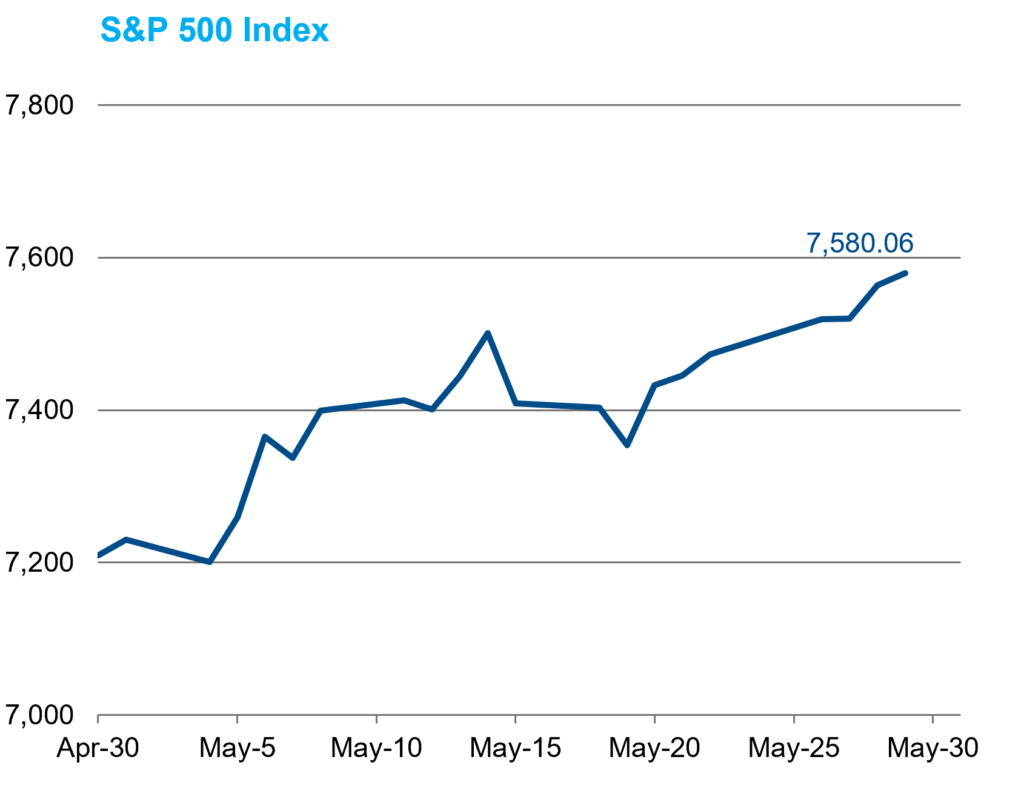
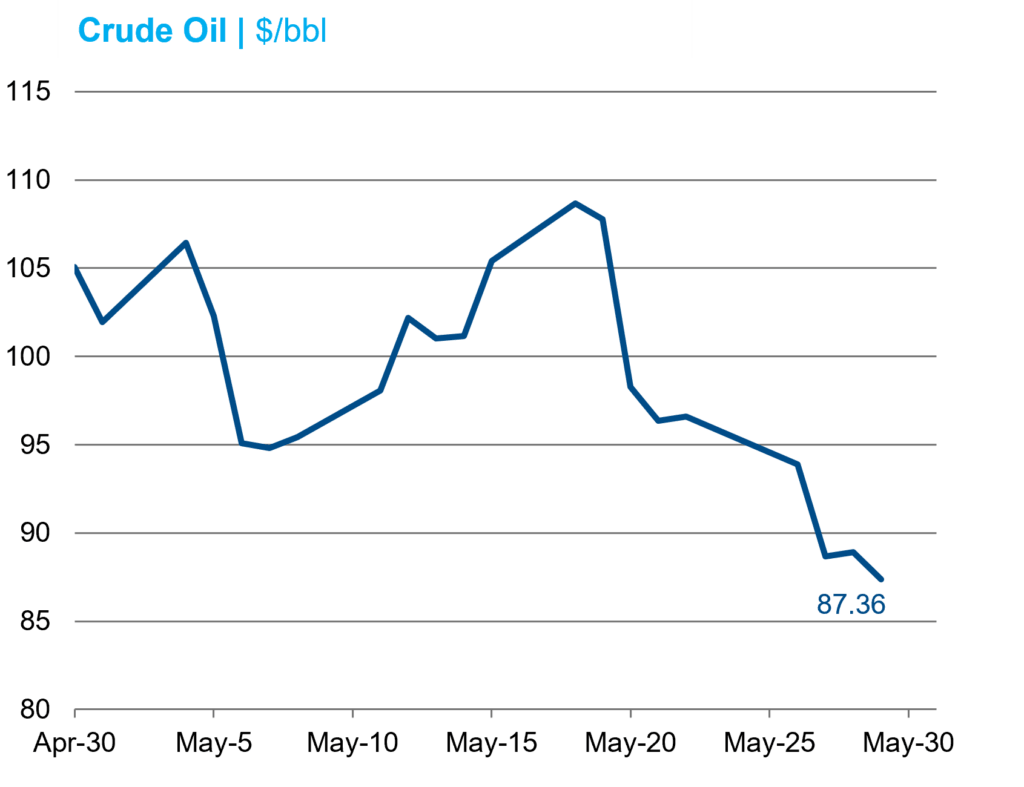
As hopes for a deal to end the conflict in the Middle East ebbed and flowed, historically strong corporate earnings results helped equities power through the uncertainty. The S&P 500 closed at a new all-time high 11 times in 20 days on its way to a solid 5.3% return. Credit spreads tightened over the first half of the month, then remained largely rangebound over the latter half as supply remained heavy. J.P. Morgan reported $163 billion in investment-grade issuance, 22% over the average of the trailing four Mays. By contrast, the month saw only $27.0 billion of high-yield issuance, under the trailing $31.8 billion average since 2010. WTI fluctuated on Iran headlines, even testing YTD highs mid-month, but eventually ended 16.9% lower on optimism for a resolution. Treasuries sold off for the third straight month, as the yield curve bear flattened. Even though yields ultimately finished short of their highs, the U.S. Treasury had to issue a bond with a 5% coupon for the first time since 2007. As the market priced in a more hawkish Fed, the Dollar Index rose 0.9% on gains vs. five of six constituents, while gold fell 1.7%.
Economic Data
Nonfarm payrolls growth rebounded to a 115k pace in April, topping the median estimate by an even 50k as an 8k decline in government employment was more than offset by the private sector. The three-month moving average of private nonfarm payroll growth is now at 55,000, which is low but above the estimated breakeven rate of job creation. Even though the unemployment rate rose by 0.08%, the rounded figure remained at 4.3%. For May, consensus calls for an 89k gain in nonfarm payrolls and no change in the U-3 rate when data are released on June 5. The pace of retail sales slowed to 0.5% MoM in April (from 1.6%), but remained in positive territory. The deviation in consumer sentiment indices widened further, with the Conference Board’s Consumer Confidence Index beating expectations and indicating May trailed only April for the 2026 high, while the University of Michigan’s more inflation-sensitive Sentiment Index hit a new all-time low. Housing releases managed to catch up from their shutdown-induced lag, but the indicators remained mixed overall. Manufacturing activity picked up, as hard and soft data were stronger than expected, though the uptick was linked to efforts to front-run price pressures associated with the ongoing conflict. Sentiment in the services industry weakened. Q1 GDP growth was revised 0.4% lower to a 1.6% pace in the second estimate, and personal consumption was revised to 1.4%, a 0.2% downgrade. Q2 GDP is expected to tick up slightly to ~2%.
Inflation
April CPI releases were higher than expected. Although the headline index rose at a 0.6% clip MoM, matching consensus, the YoY rate (3.8%) and Core CPI (0.4% MoM, 2.8% YoY) were all 0.1% higher than forecasts. Of note, however, the figure was biased higher by a statistical quirk dating back to the government shutdown, and there are good reasons to believe the underlying inflation trend is lower than recent readings suggest. Headline and Core PCE were a touch cooler than surveys, while PPI came in much hotter than expected. With oil’s sharp decline, inflation expectations for 10 years and less fell over the month. The 2-year breakeven led the way, settling 40 bps lower at 2.61%. The 10-year fell a more modest 9 bps to 2.40%, while the 30-year break was effectively unchanged, down 1 bp to 2.27%.
Federal Reserve
Kevin Warsh was sworn in on May 22 as the 17th Chairman of the Board of Governors of the Federal Reserve System. The FOMC did not meet in May. In public comments, Fed officials generally maintained the wait-and-see posture they have taken since the start of the Iran war, suggesting the policy rate is likely to remain on hold until there is greater clarity on energy prices. While policymakers refused to take the possibility of rate hikes off the table, most expected that energy inflation would eventually prove transitory and allow for further easing. The market-implied odds of a hike before year end rose from 20% to 80% in May. The FOMC majority voted to maintain an easing bias in the statement at the April meeting, but an increasingly vocal minority subsequently registered their support for the three voters who dissented against that language. Some hawks argued that it would be risky to rely on an AI productivity boom to facilitate near-term disinflation, setting up a debate with Chairman Warsh, who has vocalized the opposite in the last year.

Sources: Bloomberg Index Services Ltd., Bloomberg.
This overview is for informational purposes only. The information has been obtained from sources considered to be reliable, but the accuracy and completeness are not guaranteed. There is no assurance that any economic trends mentioned will continue or that any forecasts will occur. Economic data are as of the dates noted.
Disclosure Information
By accepting this material, you acknowledge, understand and accept the following:
This material has been prepared by NISA Investment Advisors, LLC (“NISA”). This material is subject to change without notice. This document is for information and illustrative purposes only. It is not, and should not be regarded as “investment advice” or as a “recommendation” regarding a course of action, including without limitation as those terms are used in any applicable law or regulation. This information is provided with the understanding that with respect to the material provided herein (i) NISA is not acting in a fiduciary or advisory capacity under any contract with you, or any applicable law or regulation, (ii) that you will make your own independent decision with respect to any course of action in connection herewith, as to whether such course of action is appropriate or proper based on your own judgment and your specific circumstances and objectives, (iii) that you are capable of understanding and assessing the merits of a course of action and evaluating investment risks independently, and (iv) to the extent you are acting with respect to an ERISA plan, you are deemed to represent to NISA that you qualify and shall be treated as an independent fiduciary for purposes of applicable regulation. NISA does not purport to and does not, in any fashion, provide tax, accounting, actuarial, recordkeeping, legal, broker/dealer or any related services. You should consult your advisors with respect to these areas and the material presented herein. You may not rely on the material contained herein. NISA shall not have any liability for any damages of any kind whatsoever relating to this material. No part of this document may be reproduced in any manner, in whole or in part, without the written permission of NISA except for your internal use. This material is being provided to you at no cost and any fees paid by you to NISA are solely for the provision of investment management services pursuant to a written agreement. All of the foregoing statements apply regardless of (i) whether you now currently or may in the future become a client of NISA and (ii) the terms contained in any applicable investment management agreement or similar contract between you and NISA.