
Economic and Market Overview
June 2026
The equity rally broadened and credit spreads widened in the face of heavy supply. Meanwhile, the yield curve flattened after a hawkish FOMC announcement and the price of oil tumbled on evolving optimism toward a resolution to the Middle East conflict.
Markets
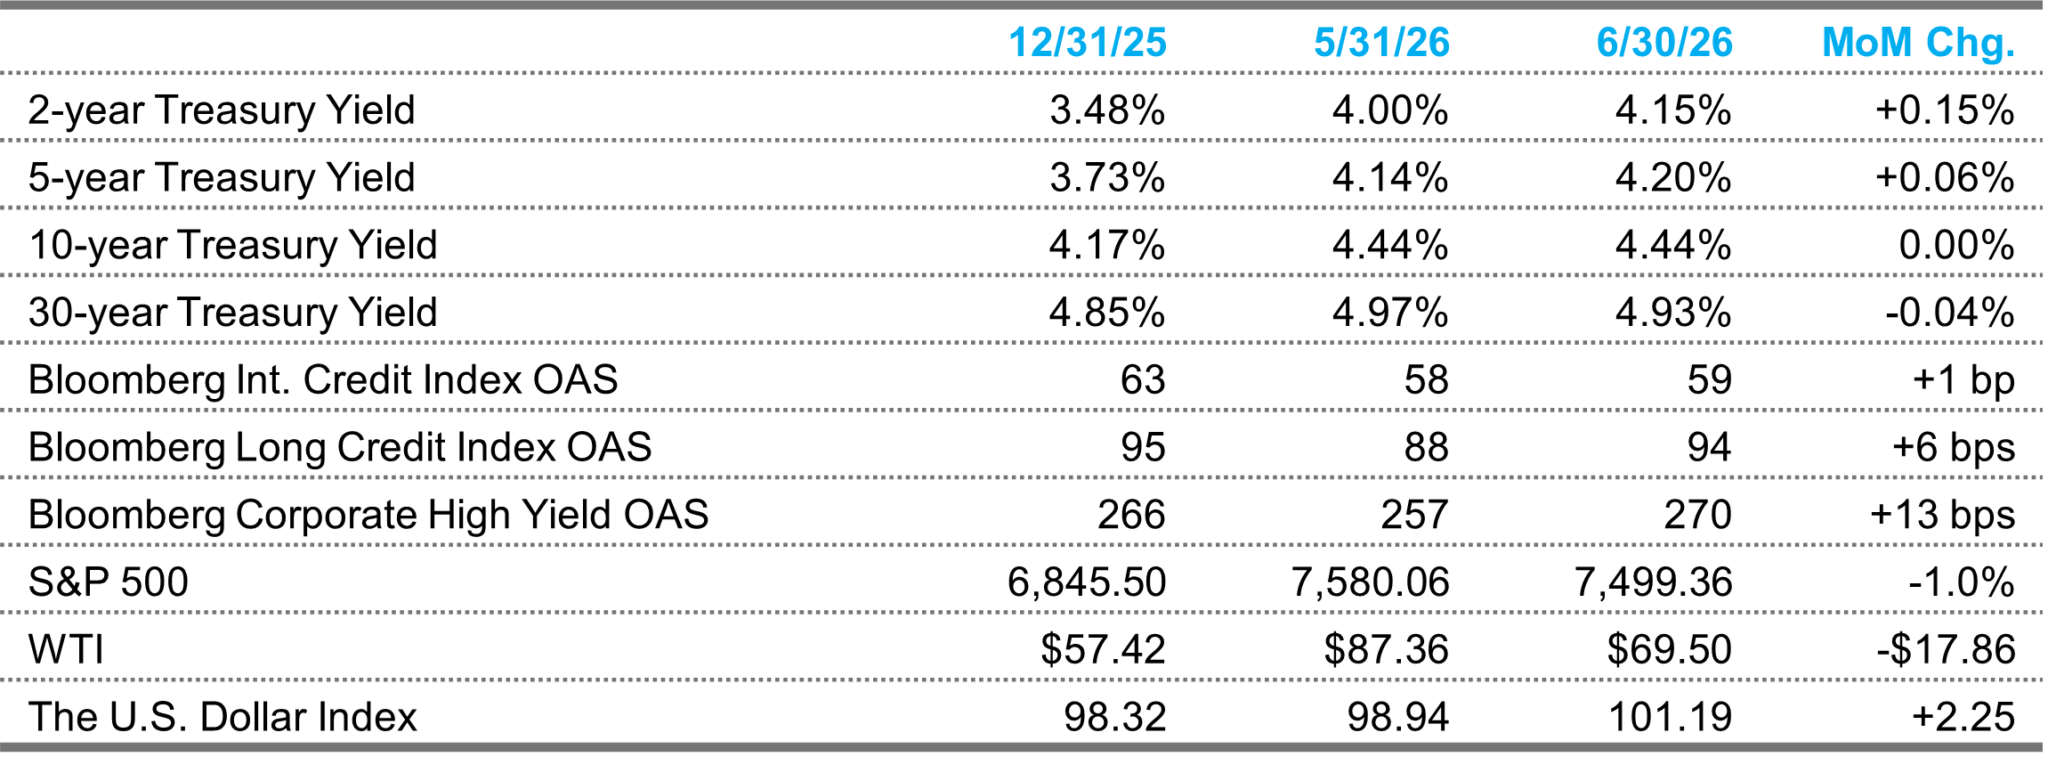
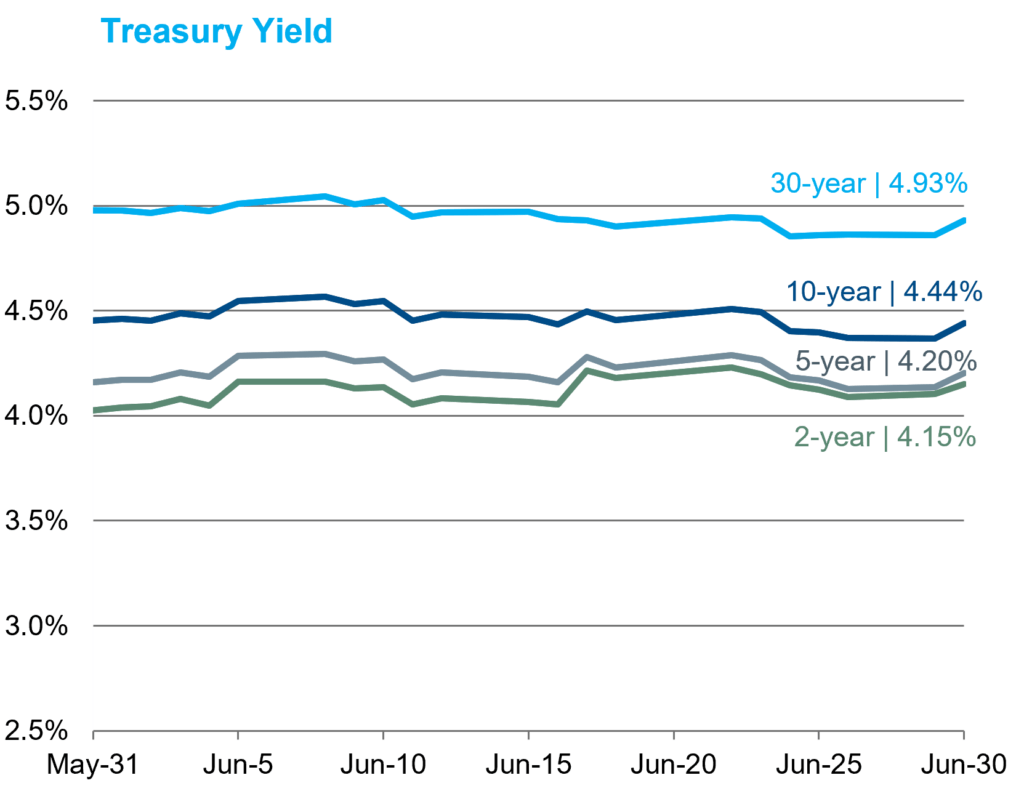
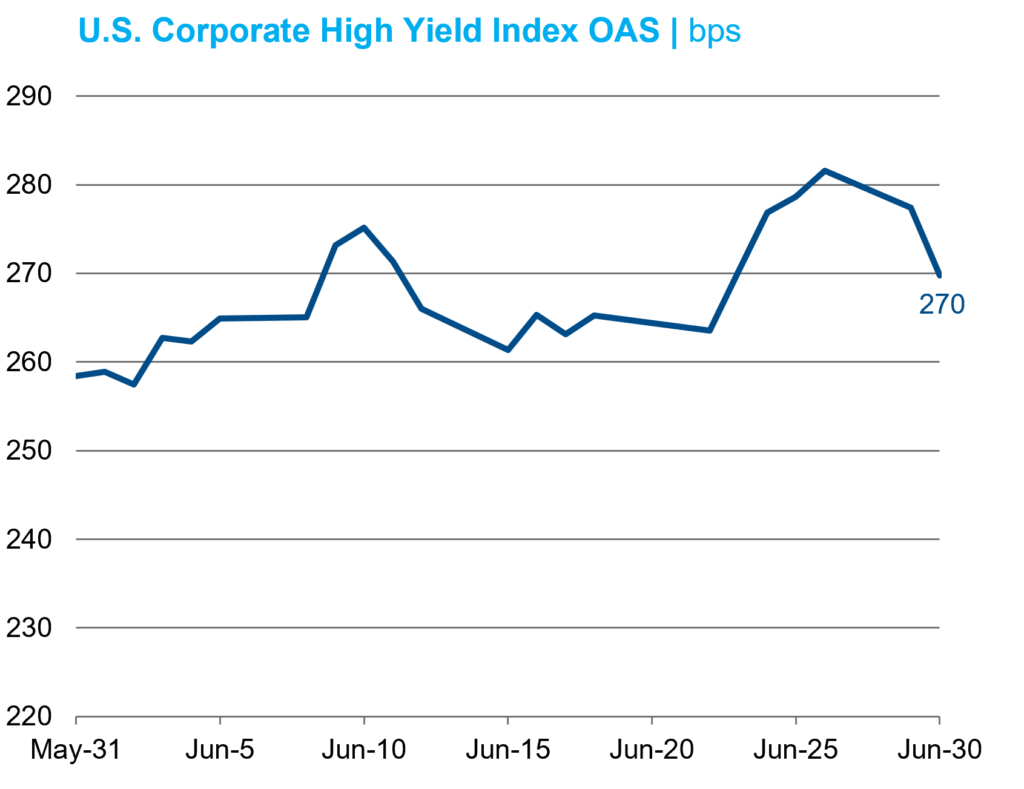
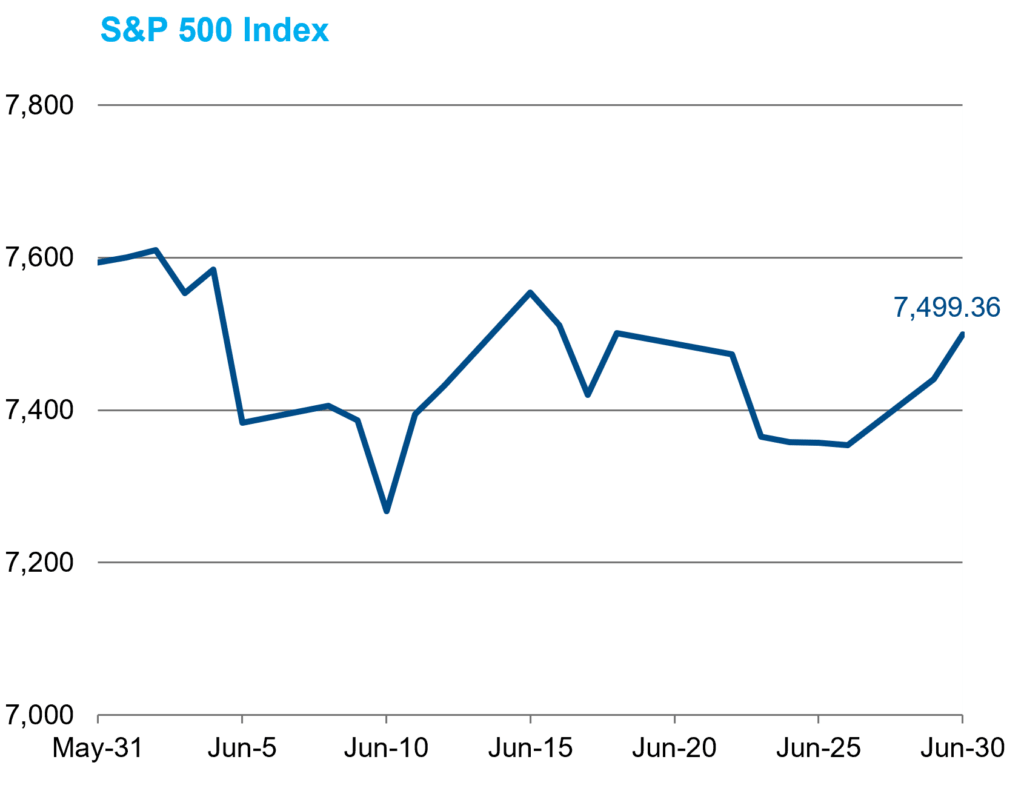
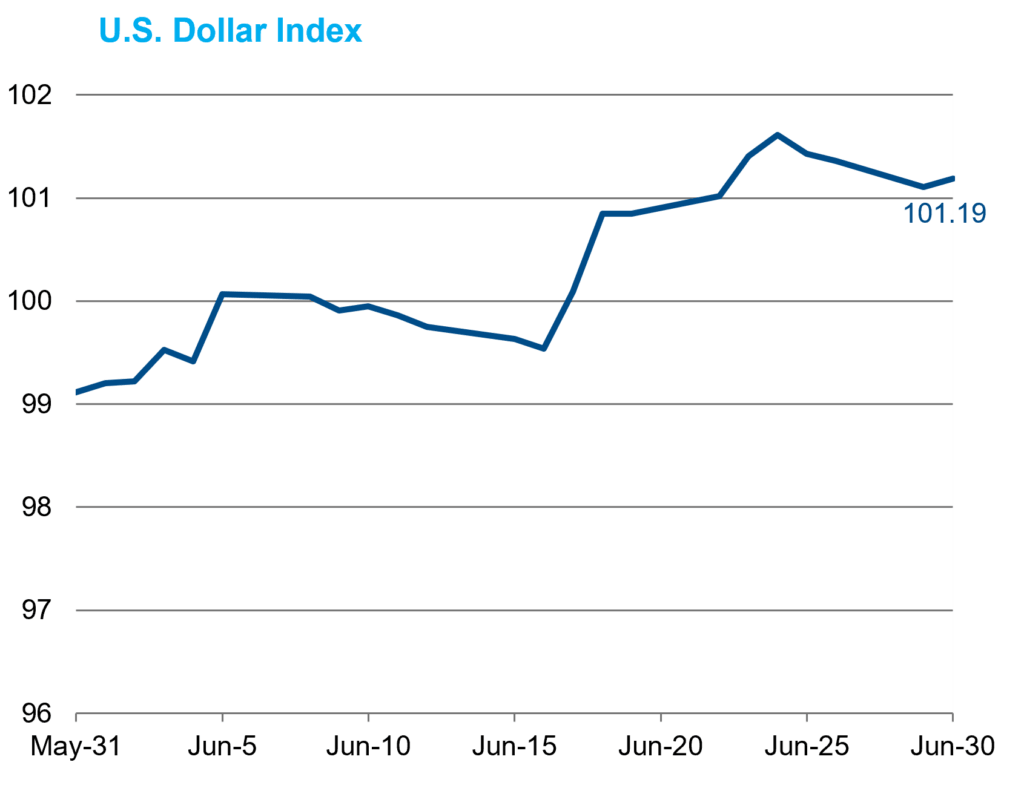
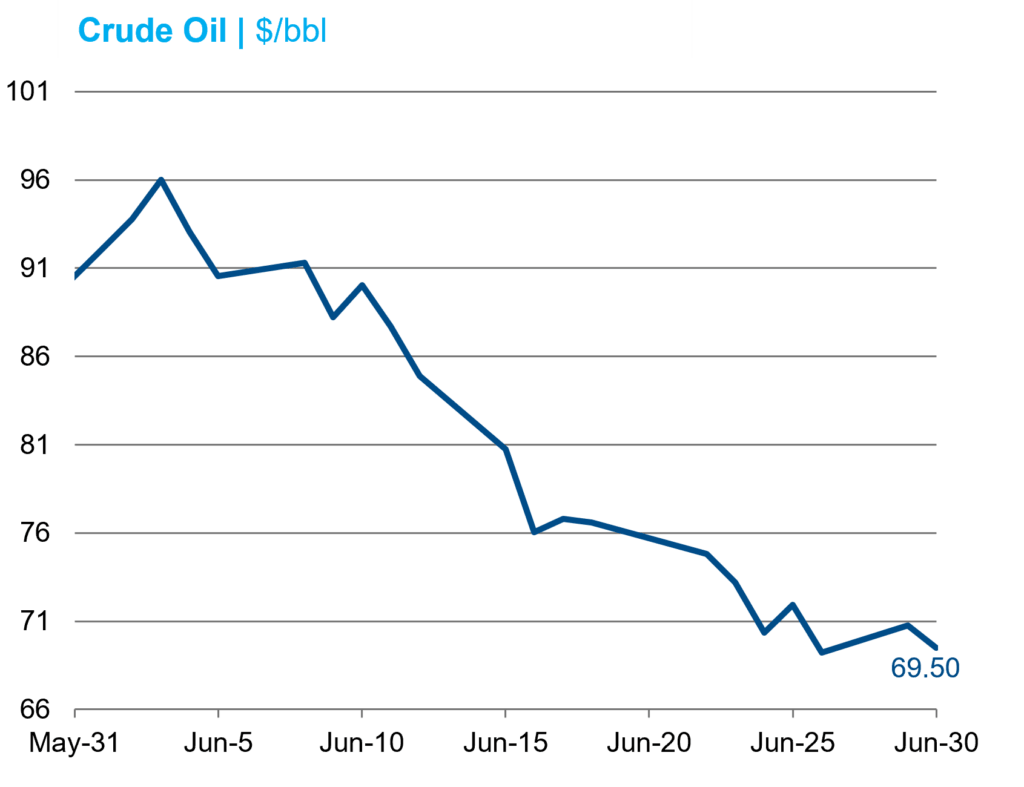
The S&P 500 closed at a new all-time high on June 2 but ultimately fell by 1% over the month. Meanwhile, the equally weighted version of the index gained 2.4% and the Russell 2000 returned 3.7%. In Treasuries, a hawkish summary of economic projections accompanied Kevin Warsh’s first FOMC meeting and sparked a bear flattening of the yield curve (see below). Credit spreads widened, particularly at the long end as supply was very heavy and included two $25 billion mega-deals from Nvidia and SpaceX. J.P. Morgan reported $204 billion in investment-grade issuance, 124% more than the average for the trailing four Junes. In high yield, the month saw $35 billion in issuance, also exceeding the trailing $25.0 billion average since 2010. WTI fell sharply on Iran headlines, finishing within a few dollars per barrel of its 2/27 close ($67.09/bbl). As front-end rates rose, the Dollar Index rose 2.3%, while gold fell 11.7%.
Economic Data
Labor market data suggested that the U.S. economy likely remains in a low-hire, low-fire state, though it is trending in a positive direction. Nonfarm payrolls growth surged at a 172k pace in May, 84k more than expected, even as the prior two months were revised up a net 93k, while the unemployment rate remained steady at 4.3%. At 188k, the 3m average of payroll growth could reflect a breakout rather than a stabilization, with job creation having bottomed in the middle of 2025, when trade policy uncertainty peaked. For June, the current consensus is for a 115k gain in nonfarm payrolls and no change in the U-3 rate when data are released on July 2. The pace of retail sales accelerated to 0.9% MoM in May (from 0.4%) and comfortably topped expectations (0.6%). Both major consumer sentiment indices increased MoM but remained below their December 2025 levels. Housing releases were mixed but disappointing on balance, as new home sales and housing starts fell well short of forecasts. Manufacturing data releases were generally stronger than expected, though the strength was again linked to efforts to front-run price pressures associated with the ongoing conflict. Sentiment in the services industry also improved. Q1 GDP growth was revised 0.5% higher to a 2.1% pace in the third release, even though personal consumption was revised down by 0.9% to 0.5%. Q2 GDP is expected to remain around 2%.
Inflation
May CPI came in at 0.5% MoM and 4.2% YoY, broadly in line with expectations, with energy prices driving much of the surge. Core CPI rose just 0.2% MoM, a downshift from April’s 0.4% and below the 0.3% consensus, while core goods prices fell for the first time in over a year, suggesting the bulk of tariff-related pass-through may be behind us. PPI came in well above expectations at 1.1% MoM, with a 23.4% surge in gasoline accounting for over half the gain in goods prices. Headline PCE ran at a 4.1% annual rate, while core PCE rose 3.4% YoY, in line with expectations. May’s PCE report may mark the peak of the latest inflation surge, as crude oil eased in June amid hopes that the Strait of Hormuz had reopened. This led to a decline in breakeven inflation rates over the month.
Federal Reserve
The most significant market-moving development was the hawkish surprise in the dot plot, which flipped from a majority projecting cuts in March to many projecting hikes in June, driving short-term rates higher. New Chairman Warsh wasted no time reshaping Fed communications, cutting the FOMC statement in half to its shortest since before the global financial crisis and signaling further changes ahead. Substantive decisions were deferred to five newly announced task forces. The June meeting was defined by a commitment to price stability and a distaste for forward guidance. However, with qualitative guidance stripped from the statement, the quantitative guidance in the dots remained and was ironically the primary driver of the hawkish market reaction. Throughout his press conference, Warsh was notably evasive, on four occasions punting to task forces rather than addressing questions relevant to the near-term policy debate. Sharing views on topics like the neutral rate or AI productivity is transparency, not forward guidance, and while the committee may wish to reduce the former, a full retreat to Greenspan-era opacity is likely a bridge too far.
Sources: Bloomberg Index Services Ltd., Bloomberg.
This overview is for informational purposes only. The information has been obtained from sources considered to be reliable, but the accuracy and completeness are not guaranteed. There is no assurance that any economic trends mentioned will continue or that any forecasts will occur. Economic data are as of the dates noted.
Disclosure Information
By accepting this material, you acknowledge, understand and accept the following:
This material has been prepared by NISA Investment Advisors, LLC (“NISA”). This material is subject to change without notice. This document is for information and illustrative purposes only. It is not, and should not be regarded as “investment advice” or as a “recommendation” regarding a course of action, including without limitation as those terms are used in any applicable law or regulation. This information is provided with the understanding that with respect to the material provided herein (i) NISA is not acting in a fiduciary or advisory capacity under any contract with you, or any applicable law or regulation, (ii) that you will make your own independent decision with respect to any course of action in connection herewith, as to whether such course of action is appropriate or proper based on your own judgment and your specific circumstances and objectives, (iii) that you are capable of understanding and assessing the merits of a course of action and evaluating investment risks independently, and (iv) to the extent you are acting with respect to an ERISA plan, you are deemed to represent to NISA that you qualify and shall be treated as an independent fiduciary for purposes of applicable regulation. NISA does not purport to and does not, in any fashion, provide tax, accounting, actuarial, recordkeeping, legal, broker/dealer or any related services. You should consult your advisors with respect to these areas and the material presented herein. You may not rely on the material contained herein. NISA shall not have any liability for any damages of any kind whatsoever relating to this material. No part of this document may be reproduced in any manner, in whole or in part, without the written permission of NISA except for your internal use. This material is being provided to you at no cost and any fees paid by you to NISA are solely for the provision of investment management services pursuant to a written agreement. All of the foregoing statements apply regardless of (i) whether you now currently or may in the future become a client of NISA and (ii) the terms contained in any applicable investment management agreement or similar contract between you and NISA.