




Key Takeaways
- The duration of a Treasury futures contract is not fixed. It depends on which bonds are likely to be delivered, and that can change as yields move, most dramatically for the 30-year contract as yields approach 6%.
- A duration based on a single cheapest-to-deliver bond can differ meaningfully from a probability-weighted view of the deliverable basket in either direction.
- Because futures’ durations can change as market yields change, it needs to be actively monitored, particularly now.
We regularly field questions from clients about the complexity of measuring duration for Treasury futures, including why duration figures from different sources do not always agree. This article is produced in part to explain where that complexity comes from and why it matters more than usual as long-term Treasury yields approach 6%.
Treasury futures are among the most efficient tools available to institutional investors for managing interest rate risk. They are deeply liquid, centrally cleared and inexpensive to trade, and they allow investors to add or remove duration without committing cash. At NISA, they are a core building block in many of the portfolios we manage.
Like any instrument, futures have mechanics worth understanding. One of the most important is the switch option. Unlike equity index futures, which are cash settled, a Treasury futures contract is tied to a basket of deliverable bonds, and market participants often use the bond most likely to be delivered as a proxy for the futures contract. However, which bond is most likely to be delivered can change as yields move, thus affecting the duration and price of the futures contract. In many rate environments, this detail has only a modest effect on risk. Today, it matters a great deal, particularly for the 30-year contract.
A Basket, Not a Bond.
A Treasury futures contract gives the seller (i.e., the short side of the contract) the right to deliver any bond from an eligible basket. For the December 2026 30-year contract, that basket includes 59 different Treasury bonds maturing between 2042 and 2051, with coupons ranging from 1.25% to 5.125%. To put these very different bonds on a comparable footing, the futures exchange assigns each bond a conversion factor: approximately the bond’s price, per dollar of face value, if it yielded 6%. The contract seller delivers whichever bond is cheapest after this adjustment, known as the cheapest-to-deliver (CTD) bond, and the futures price tracks this bond.
If every deliverable bond yielded exactly 6%, the conversion factors would leave them roughly equally attractive to deliver. When yields are below 6%, the conversion favors delivering shorter-duration bonds. When yields are above 6%, it favors longer-duration bonds. Because the futures contract takes on the characteristics of the bond expected to be delivered, its duration shifts along with the CTD. In effect, the contract seller holds an option to switch into whichever bond becomes cheapest.
What the Switch Does to Duration
Figure 1 shows how the duration of the 30-year contract changes across yield levels, alongside the shortest- and longest-duration bonds in its basket. The horizontal axis shows the 30-year Treasury yield, with the Treasury par curve shifting up or down in parallel from today’s levels. We measure futures duration as the probability-weighted duration of the deliverable bonds, using a Monte Carlo simulation of yields through delivery to estimate how likely each bond is to be delivered.
Figure 1: 30-Year Contract Duration Across Yield Levels
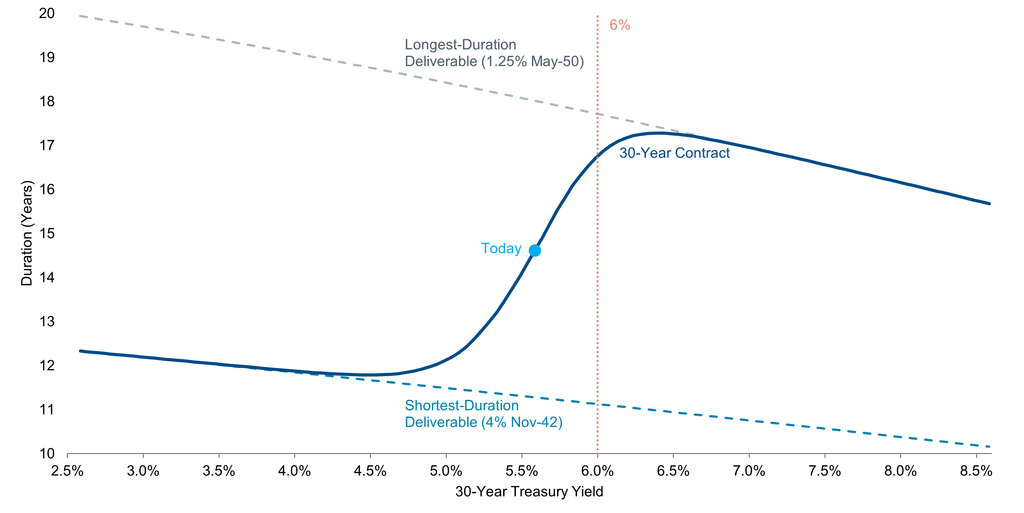
At lower yields, the contract behaves like the short end of its basket, with a duration of roughly 12 years. As yields rise toward 6%, delivery probability shifts toward the long end and duration climbs toward 17 years. Today, the contract sits on the steepest part of that transition. A 100-bps rise in yields would lengthen its duration from about 14.6 years to about 17.2 years, while a 100-bps decline would shorten it to about 11.8 years. That is the opposite of a bond, whose duration falls as yields rise.
These mechanics, duration increasing while yields rise, explain why futures can be negatively convex near the switch point, even though every bond in the basket is positively convex. None of this reflects a flaw in the contract. The switch option has value to the contract seller, and that value is reflected in the futures price. By our estimate, it is worth roughly 50 bps for the 30-year contract today.
Not Every Contract Is Equally Exposed
The value of the switch option depends on the variability of the bonds in a basket. The 2-, 5- and 10-year contract baskets are relatively homogeneous, so their durations change only modestly across yield scenarios. The 30-year contract basket spans nearly 10 years of maturities and a wide range of coupons, which makes it the most sensitive contract in the Treasury futures complex.
Figure 2: Futures Duration Under Parallel Yield Shifts | Years
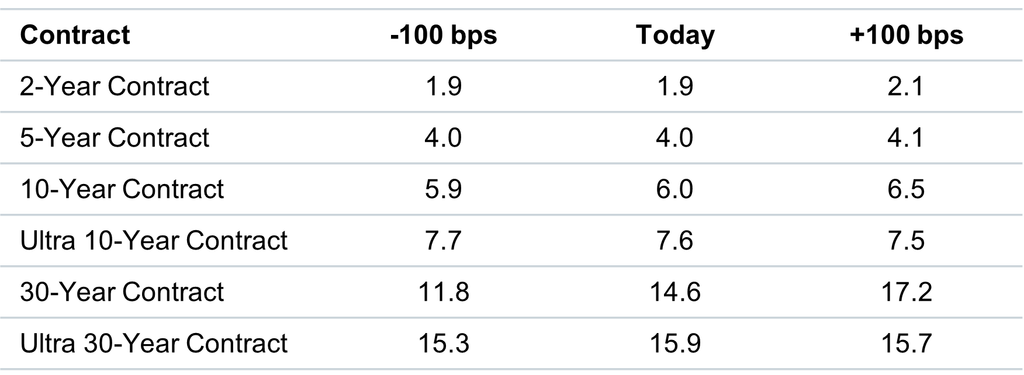
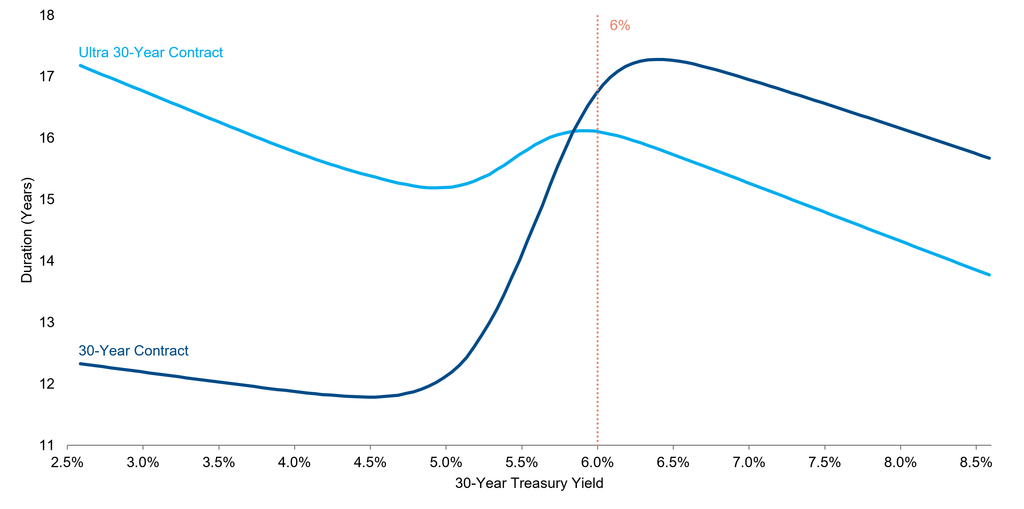
One consequence is surprising. The Ultra 30-year contract is normally the longest-duration Treasury future. Today, however, the 30-year contract basket includes a cohort of very low-coupon bonds issued in 2020 and 2021. Low-coupon bonds carry more duration than higher-coupon bonds of similar maturity, and the lowest coupon in the Ultra 30-year contract basket is 2.25%. As Figure 3 shows, if yields rise above roughly 6%, those low-coupon bonds (such as the 1.25% May 2050s) become the most likely cheapest-to-deliver bonds, and the 30-year contract duration would exceed the duration of the Ultra 30-year contract.
Figure 3: 30-Year vs. Ultra 30-Year Contract Duration
The CTD Is Not the Whole Story
A common shortcut is to treat a futures contract as if it were its current CTD bond and use that bond’s duration. When one bond is very likely to be delivered, the shortcut works well. When delivery is uncertain, it can be misleading. Figure 4 compares the two measures for each contract, along with the highest delivery probability of any single bond in the basket.
Figure 4: CTD Duration vs. Probability-Weighted Duration | Years
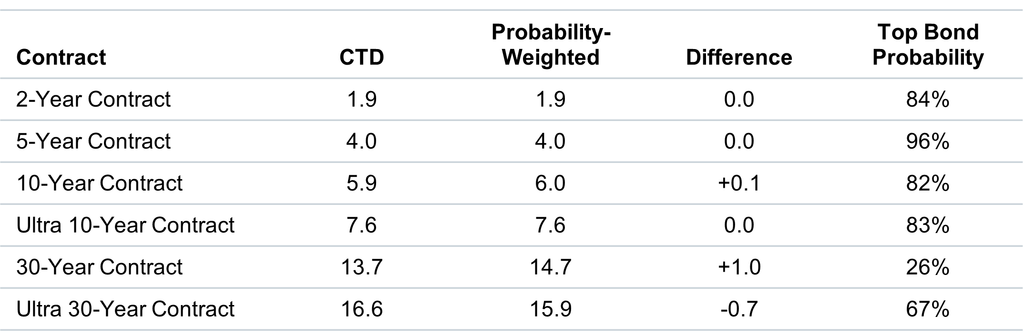
For the shorter contracts, the two measures agree because one bond dominates delivery. For the 30-year contract, no single bond has better than roughly a one-in-four chance of being delivered, and the CTD’s duration understates the probability-weighted duration by about a year. For the Ultra 30-year contract, the gap runs the other way: the CTD is the longest-duration bond in its basket, so relying on it overstates duration. Reports built on a single CTD, a common convention in market data systems, can therefore tell a different story from one that reflects the full basket.
Already in Motion
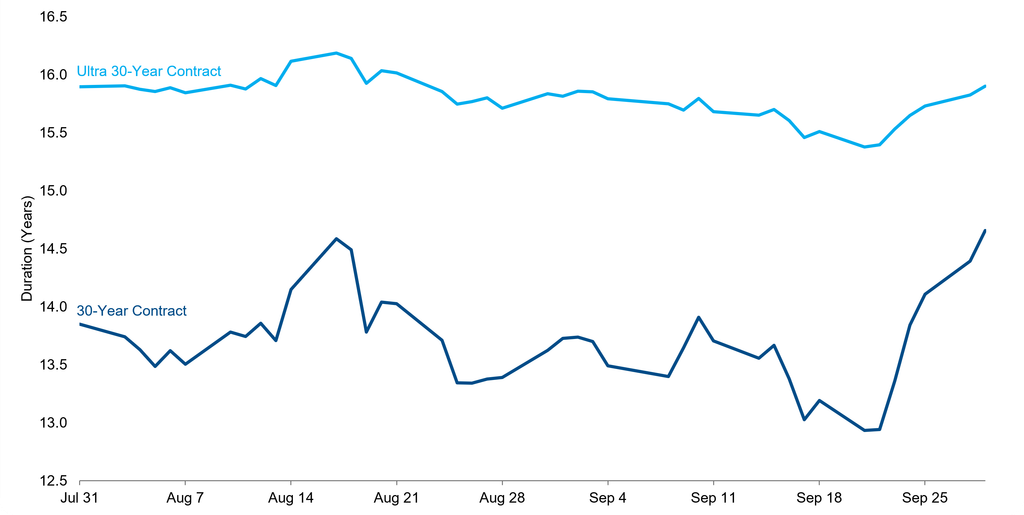
Figure 5 tracks the duration of both contracts over the past two months, using the delivery probabilities we estimate each day. Between Sept. 21 and Sept. 29, the average yield of the 30-year contract basket rose about 33 bps, and the contract’s duration increased from 12.9 years to 14.7 years, an increase of roughly 13%. Over the full two-month period, the duration of the shortest-duration bond in the basket drifted lower, as bond durations typically do when yields rise. The Ultra 30-year contract moved much less.
Figure 5: Contract Duration | Last Two Months
How These Details Can Impact Your Portfolio
For investors who use Treasury futures to hedge liabilities or manage portfolio duration, the practical implications are straightforward:
- Duration can change without a trade. A position sized to a duration target can drift meaningfully as yields move, particularly for the 30-year contract.
- The duration measure matters. As Figure 4 shows, a measure based only on the CTD can differ from a probability-weighted measure by as much as a year, in either direction.
- Monitoring frequency matters. Hedge ratios established in a lower –interest-rate environment may need to be revisited more often as yields approach 6%.
- Contract selection matters. Near the switch, the 30-year and Ultra 30-year contracts can behave quite differently, and their usual relationship can reverse.
Conclusion
Treasury futures remain an efficient tool for managing interest rate risk. The switch option is a feature of their design and it is reflected in market prices. But it means the futures’ duration is not a static number. As long-term yields approach the 6% conversion-factor yield, the difference in duration between a futures contract and any single bond in its basket can become large.
At NISA, we estimate delivery probabilities daily for each Treasury futures contract, measure futures duration on a probability-weighted basis and monitor how shifts in those probabilities can affect the risk profile of the portfolios we manage. When a futures duration figure differs from a CTD-based report, the switch option is usually the reason.