Introduction
Market indices serve as a barometer of market segment performance and are a means by which investors can evaluate strategies. Price-based indices which measure the value and performance of financial assets have been available for over 100 years. More recently, market participants have developed volatility-based indices to measure market risks. Though lesser known, a variety of providers offer measures of pension funds’ health by estimating the average funded status of a variety of plan sponsors.
Indices that track the average funded status of pension plans are a good starting point in benchmarking pension fund conditions. Unfortunately they are backward looking – the current measures merely convey where the average plan has been over time.
While all of these data are useful to pension fund fiduciaries, we believe a more forward looking, pension-centric index would be even more valuable. An index that encompasses the past, as measured by average funded status, and the future, as measured by funded status volatility, could provide a much more useful metric. With this in mind, NISA Investment Advisors, LLC (NISA) is pleased to introduce the Pension Surplus Risk Index, or PSRX*.
The PSRX
The PSRX provides pension funds with a forward looking estimate of the average funded status volatility for large defined benefit pension plans. The PSRX incorporates information from the equity, fixed income, derivative and alternatives markets, as well as funded status itself, to gauge general funded status volatility. Importantly, measures of asset class volatility are derived from their various risk factors: rates and yield curve exposure, spread exposure, and equity market risk. Additionally, PSRX sub-indices allow pension funds to more accurately identify and monitor their individual funded status volatility by referencing their current funded status, liability duration, and risk asset allocation to published sub-indices. These indices allow pension funds to approximate the level of surplus risk in their plans relative to the overall defined benefit pension community.
Methodology Overview
The PSRX reflects the average of the individual funded status volatilities for the index-constituent plans. Constituent plans are:
- US defined benefit corporate pension plans;
- Publicly-traded; and
- The 100 largest plans based on pension liability present value (PBO), as determined by NISA from publicly available documents, and re-constituted annually.
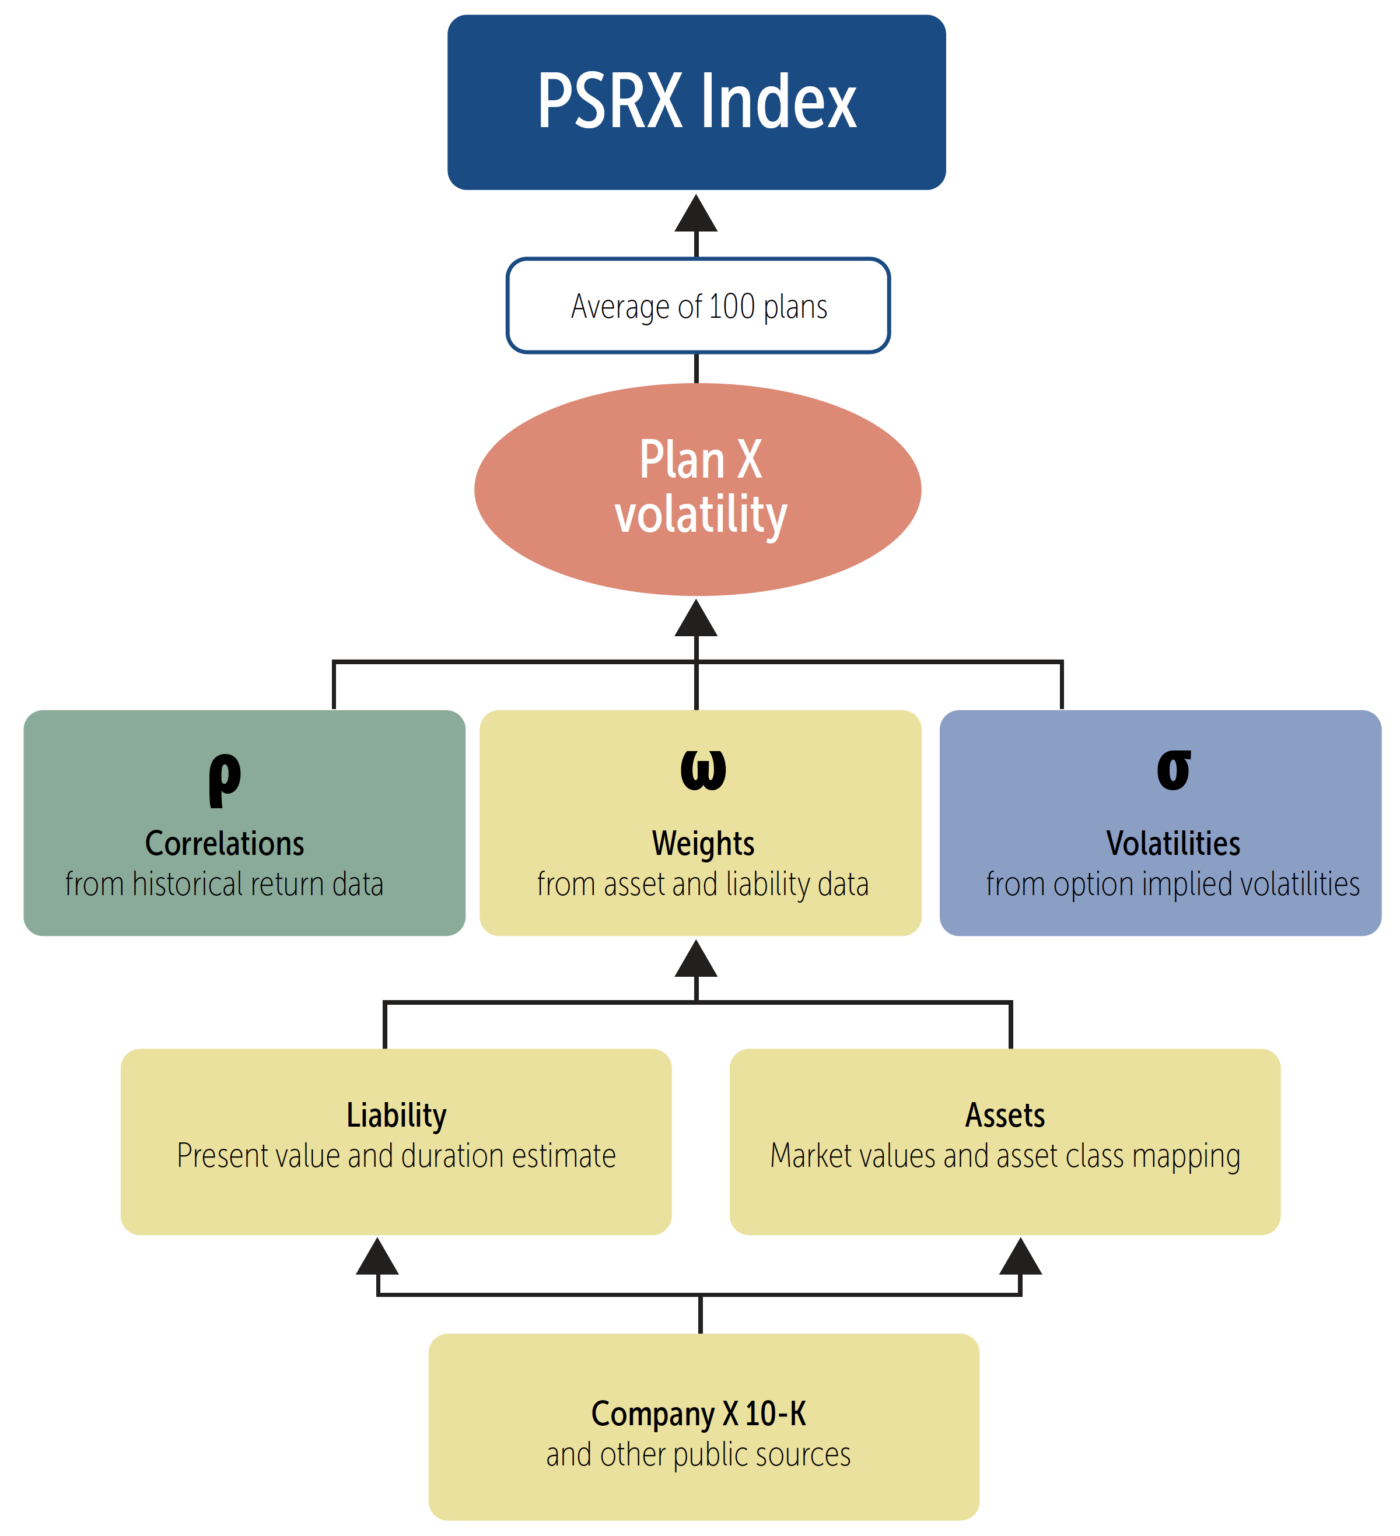
Deriving individual plan volatilities involves three main components:
- Plan-specific asset allocation and liability data, derived from publicly available sources;
- Implied volatilities for various markets from traded options; and
- Correlations between the various asset classes and liability components from historical data.
Index constituents are determined annually and updated by NISA with the April 30th index release. Plans with poor data quality are removed from the index. Each monthly index update reflects current implied volatility data from option markets, a “roll forward” of asset and liability figures to reflect market movements year to date, and updated correlation calculations.
PSRX Market List Determination/Data and Sources
The PSRX is developed by NISA with estimates of the funded status and asset allocation for each of the largest 100 corporate defined benefit plans as determined by NISA. The largest plans are identified based on the size of their liability. The measured liability is the qualified portion of US Defined Benefit plan(s) for each company, where available. NISA uses the data provided in 10-Ks, 20-Fs, and Annual Reports to identify assets, liabilities, asset allocations and liability durations. The liability compilations are reconstituted annually and reflected in the April 30 index publication.
Index components are compiled from:
- Asset and Liability values – Each plan’s asset market value and liability value are generally collected from a firm’s 10-K. When the 10-K is unavailable (foreign corporations), the firm’s 20-F (if available) and/or annual report are used. When sufficient information is available, only the qualified US portion of the pension plan is used. Asset and liability values are used to compute funded status as of each year-end.
- The largest 100 plans are identified annually based on the 10-Ks filed with the SEC by March 31st. Relevant data from the 10-K is adjusted by NISA to April 30th using market returns for assets and liabilities since the 10-K release date.
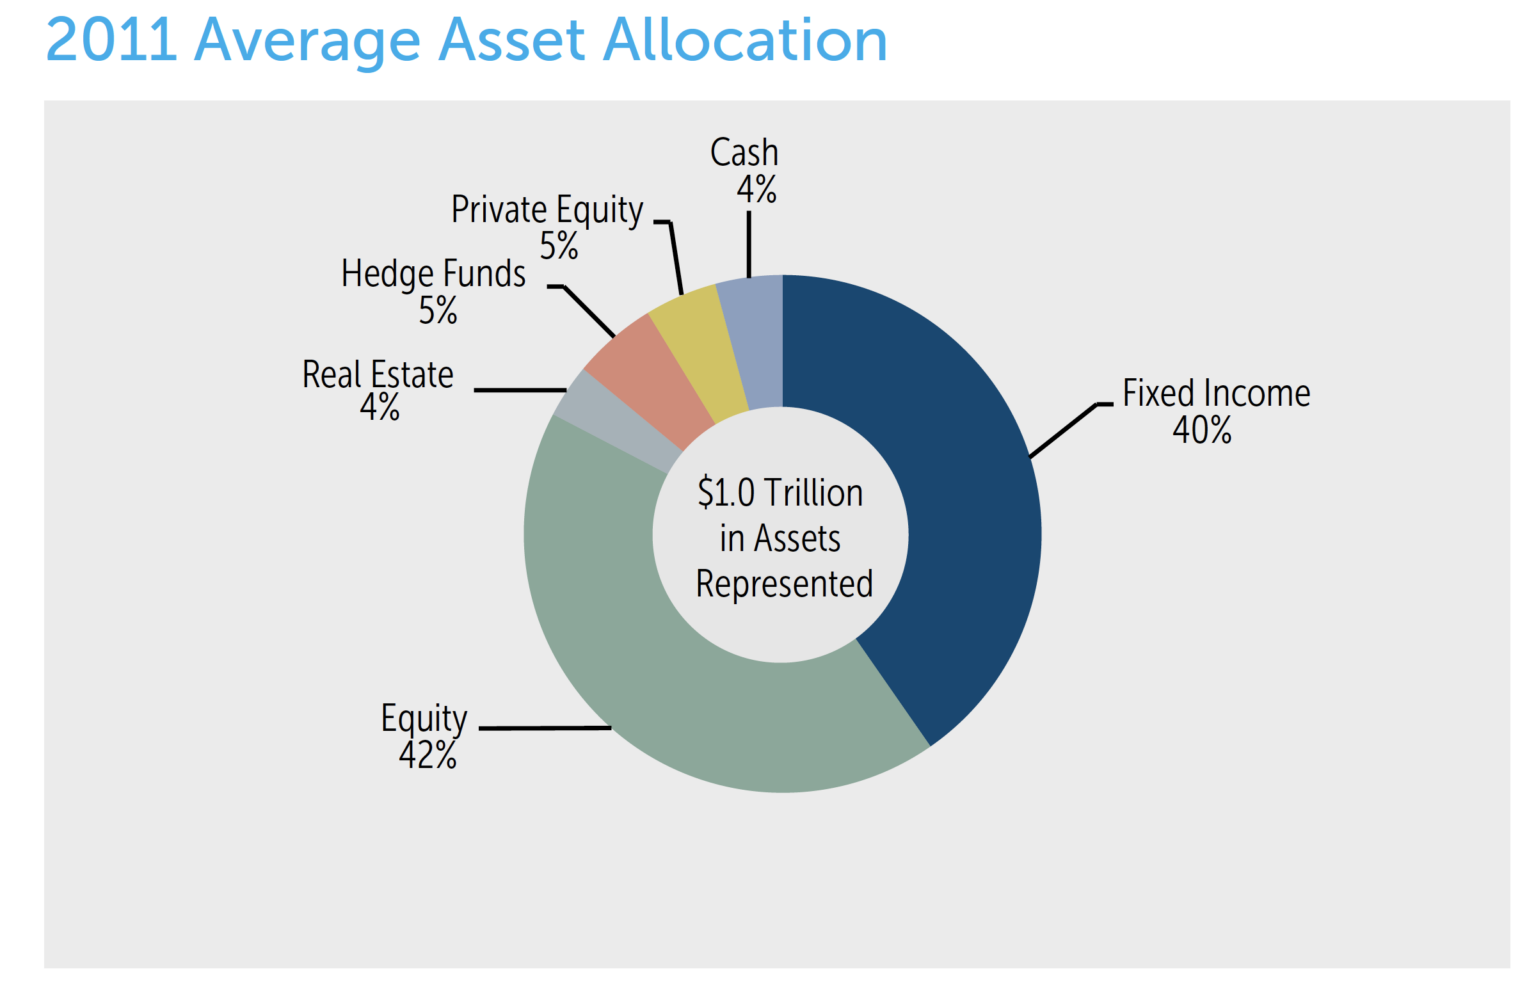
- Asset Allocation – Publicly available information on plan asset allocation varies greatly among firms. Many plans provide only a breakdown between equity and fixed income, while others provide a detailed breakdown of all asset classes. For the PSRX, all asset classes are grouped into Equity, Fixed Income or Alternatives by NISA.
- The equity asset class is then sub-classified into US Large Cap, US Small Cap, Developed International, or Emerging Market Equity. When a reported equity allocation does not directly map into one of the above categories (ex. Company Stock), the allocation is placed in the closest available asset class or classes based on NISA’s judgment. In the example above, company stock would increase the allocation to US Large Cap Equity.
- Fixed income asset information provided on the 10-K is mapped into one fixed income asset class for PSRX purposes. The composition of the fixed income component of the PSRX is discussed in the portfolio construction section.
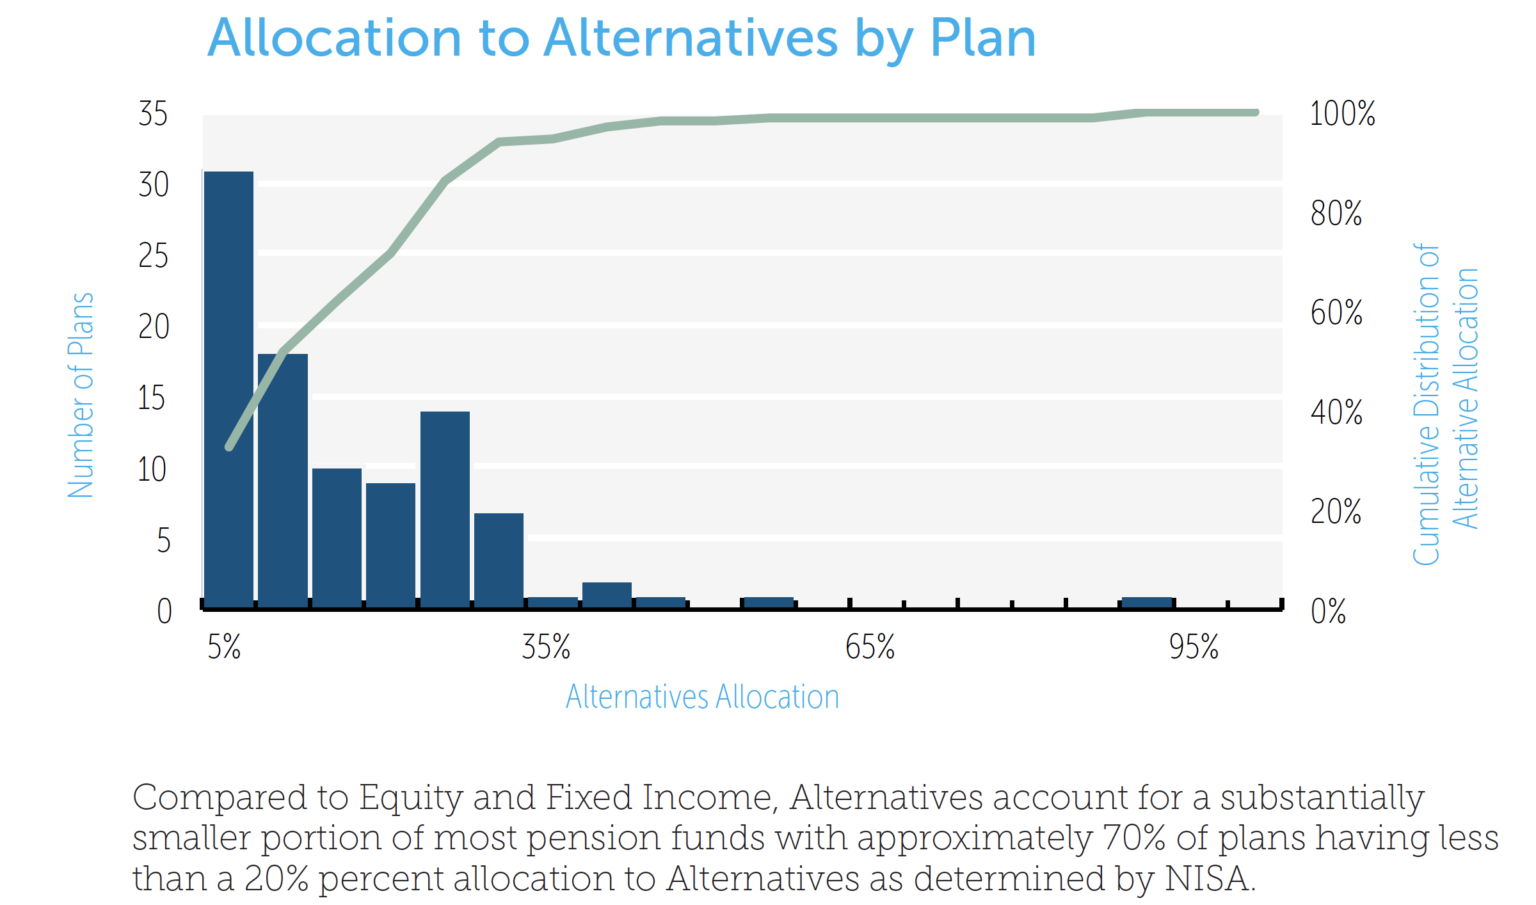
- Alternatives are sub-classified as Real Estate, Hedge Funds, or Private Equity. When obvious, assets are mapped to the appropriate alternative asset class. Due to a lack of consistency in the way firms report Alternatives, asset classes not readily identifiable as equity or fixed income are mapped to “Alternatives”. The graph below illustrates the distribution of the Alternatives asset class across the largest 100 plans for December, 2011.
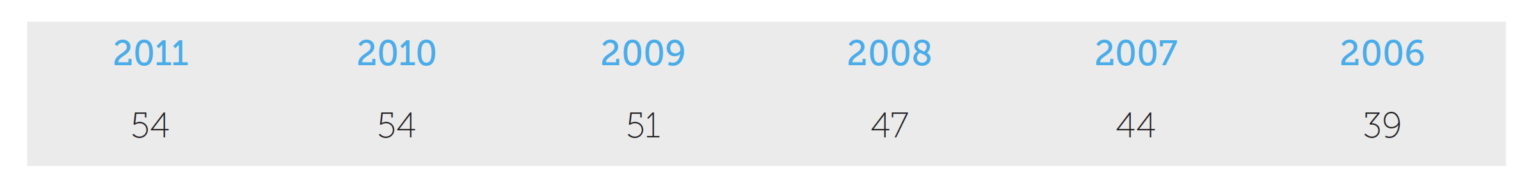
- Liability Duration – Although the duration of the liability is not directly provided in 10-Ks, some firms report the sensitivity of the liability value due to a given change in interest rates. This information is used by NISA to imply the liability duration. This information is available for approximately 50% of the firms. The graph below illustrates the distribution of liability duration for these plans as of December, 2011. In general, there is a fairly tight grouping among plans. For example, 50% of the reported durations lie between 10.4 and 13.7, with an average duration of 12.1.
The table below shows the number of plans in the index universe reporting interest rate
sensitivity estimates by year.
For plans that do not report interest rate sensitivity estimates, duration is estimated by NISA by regressing changes in the plan discount rate on actuarial gains and losses as reported in the 10-K.
(Actuarial Gains or Losses as a % of Liability Value / Beginning of Year PBO) = Intercept + (-Estimated Duration) * Change in Plan Discount Rate + Residual Error.
For this calculation we use the last 10 years of data, where available. Actuarial gains and losses can include changes in mortality, payment assumptions, salary growth rate, etc. By using 10 years of data, however, NISA expects changes in discount rates to be the primary driver of actuarial gains and losses. And unless the other drivers of actuarial gains/losses are correlated with changes in the discount rate, the slope from the regression should be an unbiased estimator of the interest rate duration of the plan. Overall, the technique provides duration estimates with reasonable error bands, in our opinion. For example, the charts on the next page show an illustrative fit with a high level of confidence in the duration estimate. For the first firm shown below, the duration is estimated at 12.1 years with a standard error on this estimate of 0.65 years.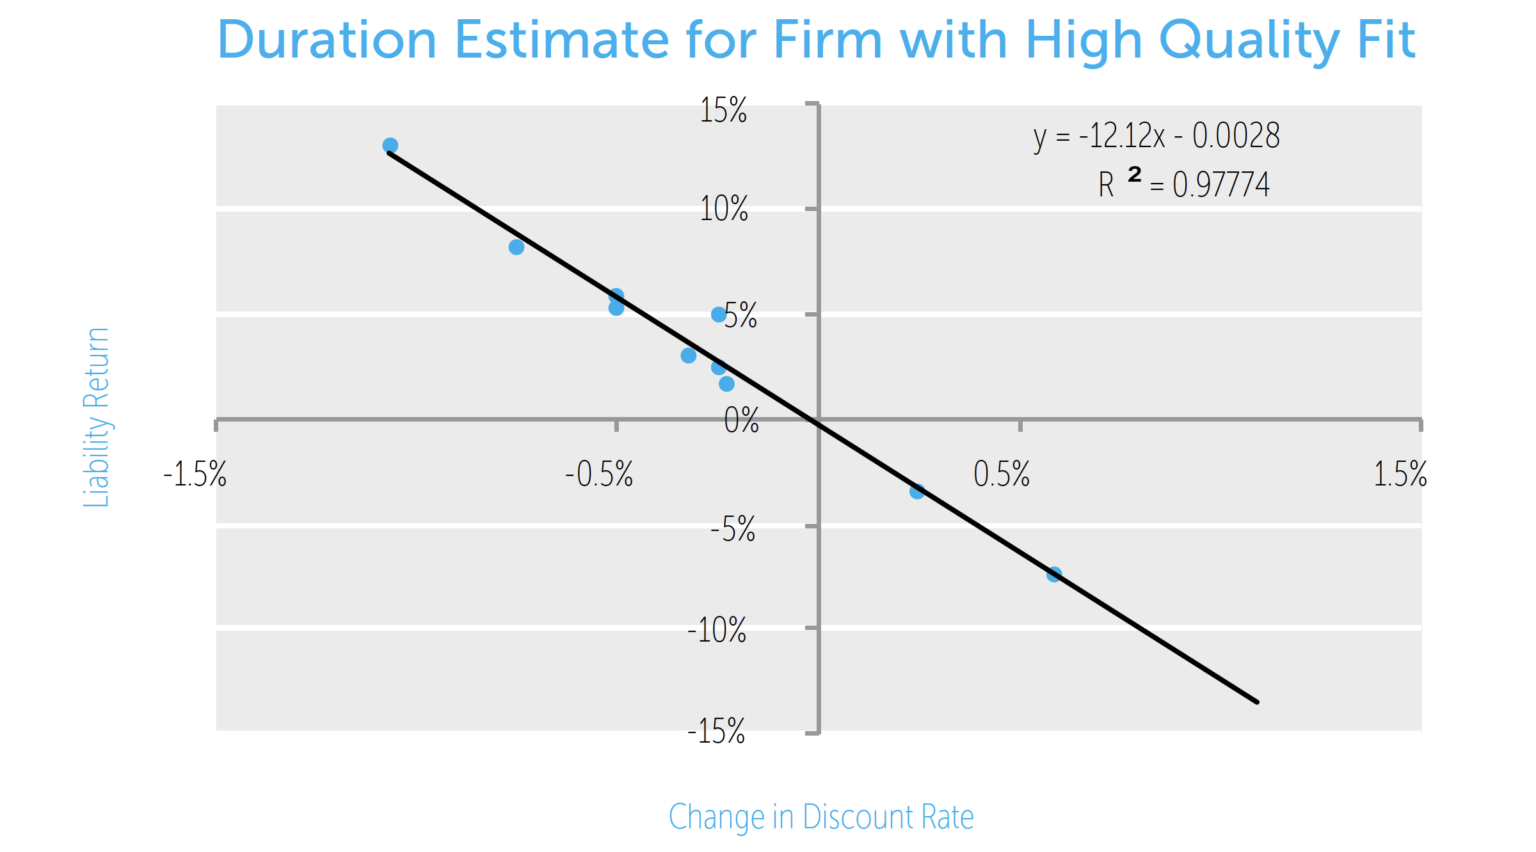
In some cases, the fitted duration suggests that the reported actuarial gains/losses are not related to the discount rate movements. For example, the chart below shows a fit with a low level of confidence in the duration estimate. For this firm the duration estimate is 4.3 years with a standard error on this estimate of 3.3 years.
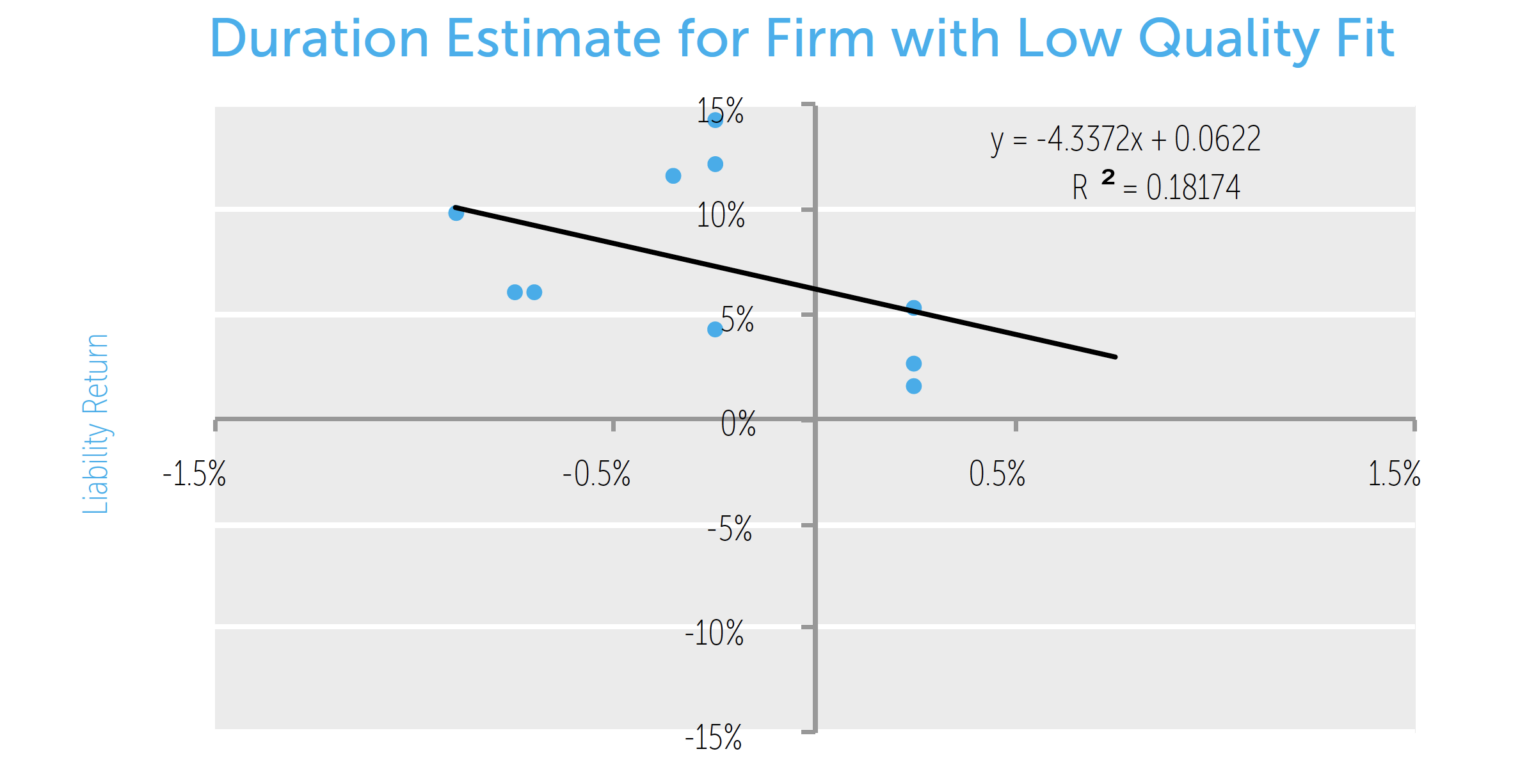
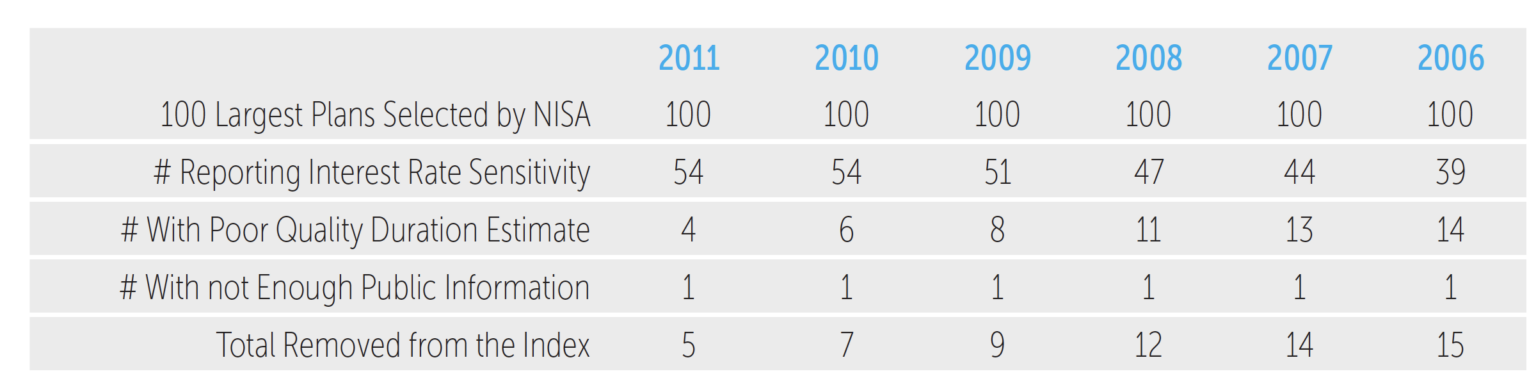
In order to purge the index of erroneous duration estimates, firms with a standard error of the duration estimate greater than 3 years are removed from our list of 100 companies. This method is used for 2011, 2010, and 2009 plan years. Due to a shorter window or data available to make duration estimates, we back fill duration estimates prior to plan year 2009 by starting with the 2009 duration estimate and adjusting based on what is implied by the changes in the corporate or discount curve.
The table below shows the number of firms removed from the PSRX by year:
Collection & Calculation of Risk Inputs
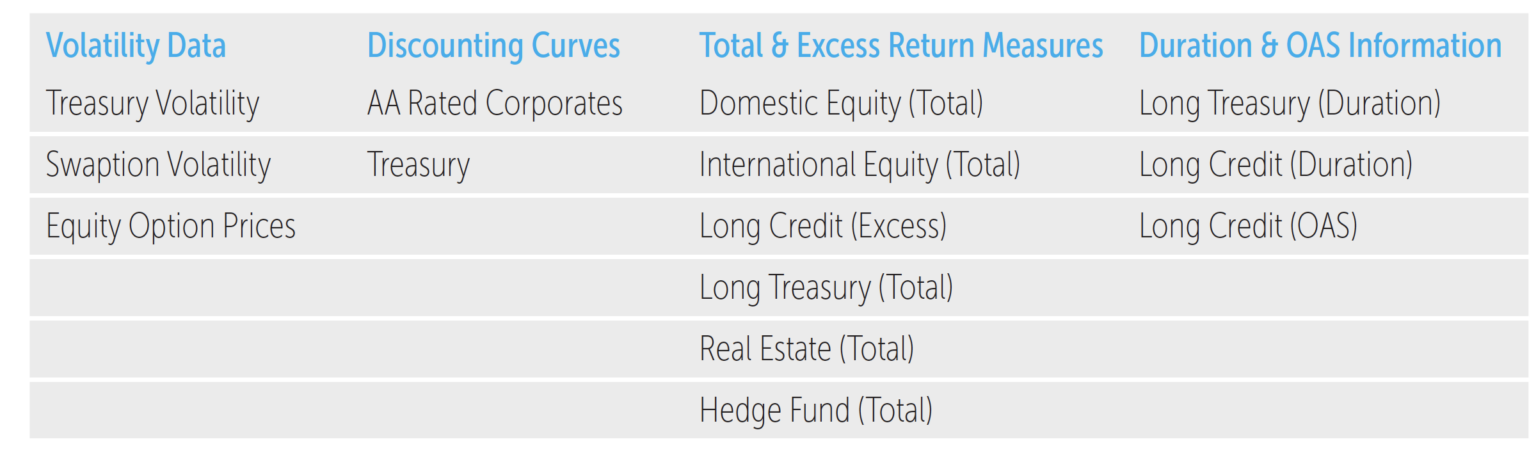
When computing the PSRX, NISA incorporates estimates of volatility and correlation. Market-based, prospective volatility estimates (i.e., implied option volatility) are available for many markets and represent key inputs into the calculation of the PSRX. Prospective correlation measures are generally not available so historical data are used to develop estimates. Historical data collected for the PSRX include total and excess returns, and bond spread and duration for a variety of markets. For each input NISA uses multiple sources, including internal estimates. After consolidating all available sources, NISA determines what value, or combinations thereof, will be used for a given month. The table below lists the market variables collected monthly.
Volatility Measures
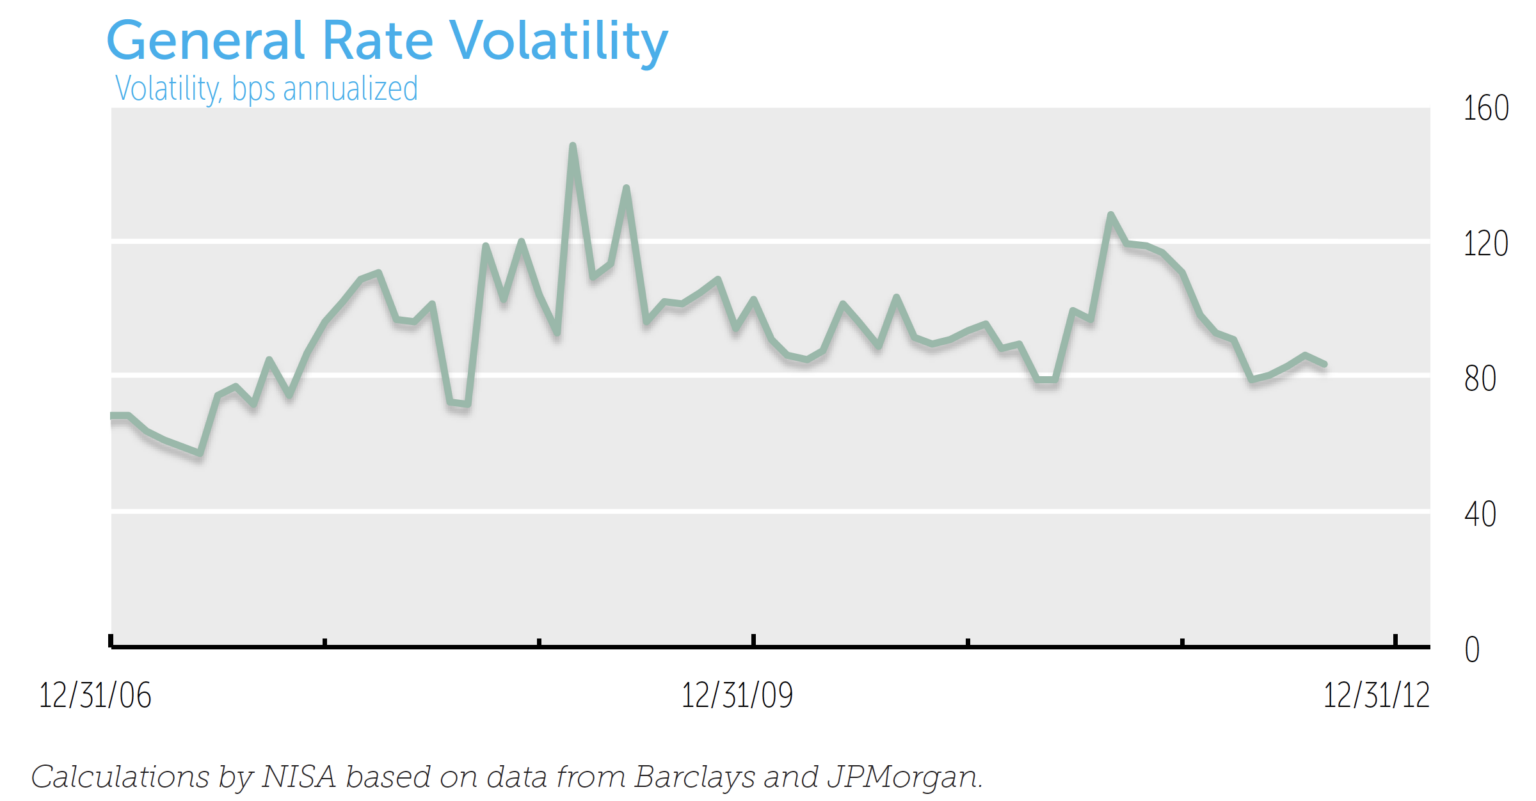
General Rate Volatility
A significant determinant of the PSRX level is the prospective estimate of general interest rate volatility. Ideally an option on a 20-year Treasury bond would be used, since it is close to the duration of the typical liability. Since these options are not readily available, data from other Treasury options as well as swaption markets are the basis for NISA’s estimate of general rate volatility.
The graph below shows a history of the resulting calculation of forward looking general rate volatility assumed in the PSRX.
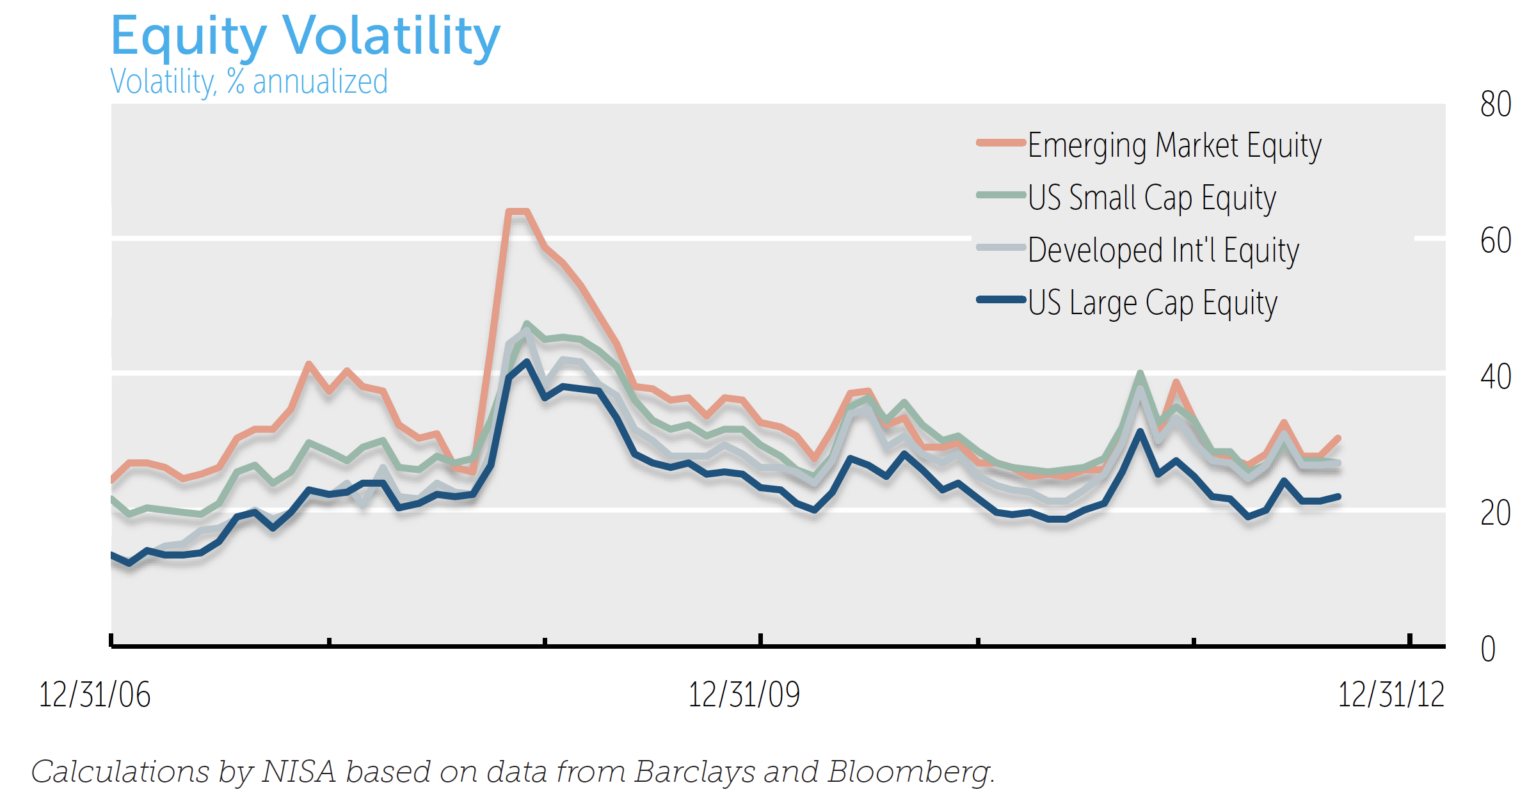
Risk Asset Volatility
For the four equity-based risk assets – US Large Cap, US Small Cap, Developed International, and Emerging Market Equity – we use exchange traded options to derive our volatility estimates. Specifically, we compute the twelve month at-the-money option-implied volatility based on readily available equity options prices. The graph below presents the option-implied equity volatiles used in the PSRX.
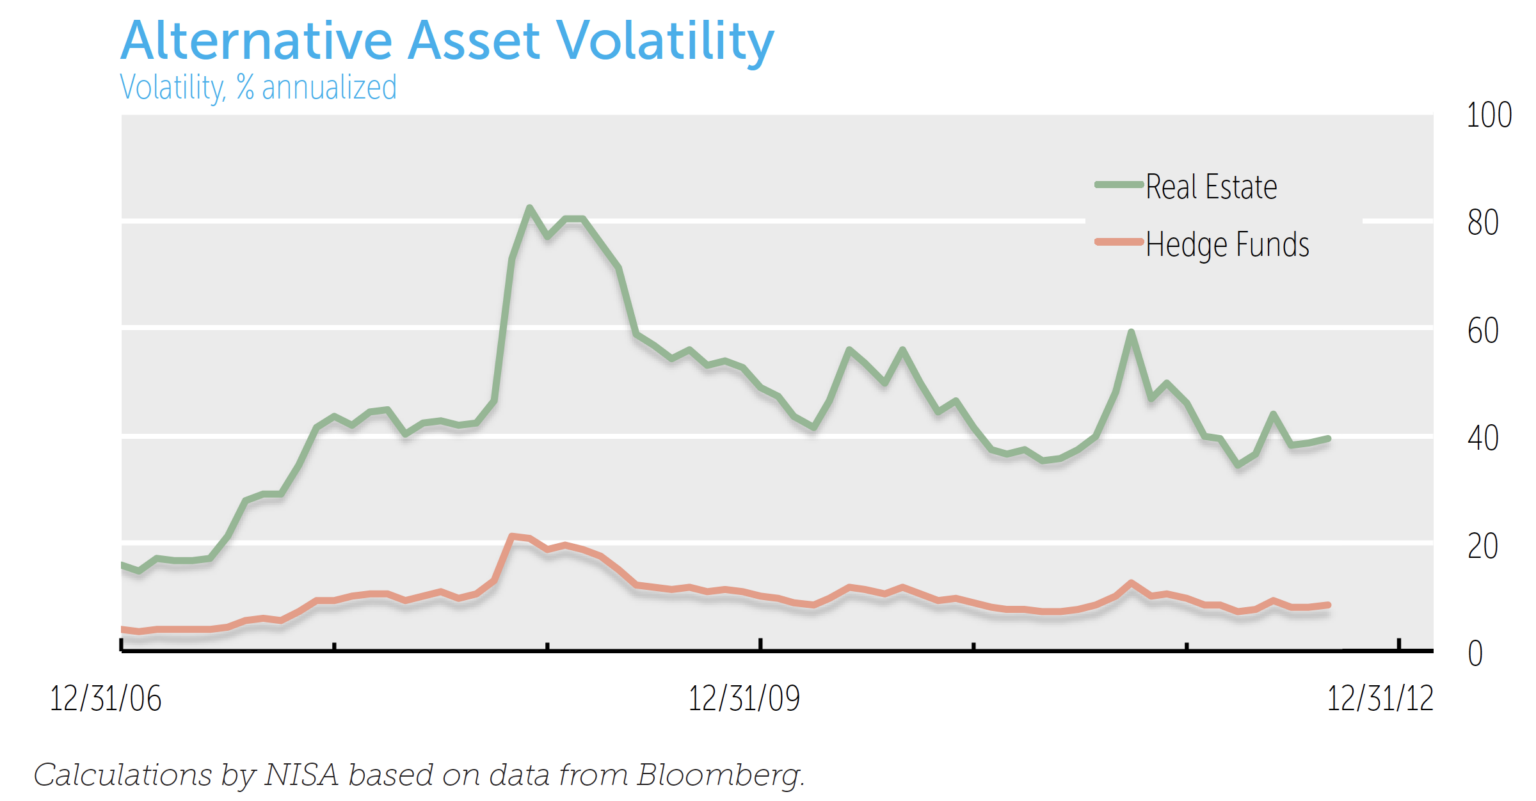
We use a benchmark of liquid US REITS to establish volatility assumptions for the Real Estate asset class. The Hedge Fund asset class is based off of broad-based multi strategy hedge fund indices. Real Estate and Hedge Fund markets do not have readily observable option markets. For these markets the prospective volatility is calibrated by looking at the five-year historical relationship between these markets and the US Large Cap Equity market as calculated by NISA.
Each month the current implied volatility of the US Large Cap Equity market is multiplied by the historical volatility ratio between Hedge Funds or Real Estate and US Large Cap Equity asset classes. The chart below illustrates the volatilities for Hedge Funds and Real Estate used in the PSRX.
Forward looking volatility for Private Equity is developed by NISA from US Small Cap Equity volatility. We use the implied volatility from US Small Cap Equity applying a beta of 0.35. The beta assumption reflects the historical relationships between private equity pricing and US Small Cap Equity. To assess the sensitivity of the beta assumption on the Private Equity asset class, we examined the impact those assumptions have on the PSRX. Since the average allocation to Private Equity of the Top 100 plans in 2011 was 4.3%, the impact is small for a wide range of beta assumptions (0 to 1).
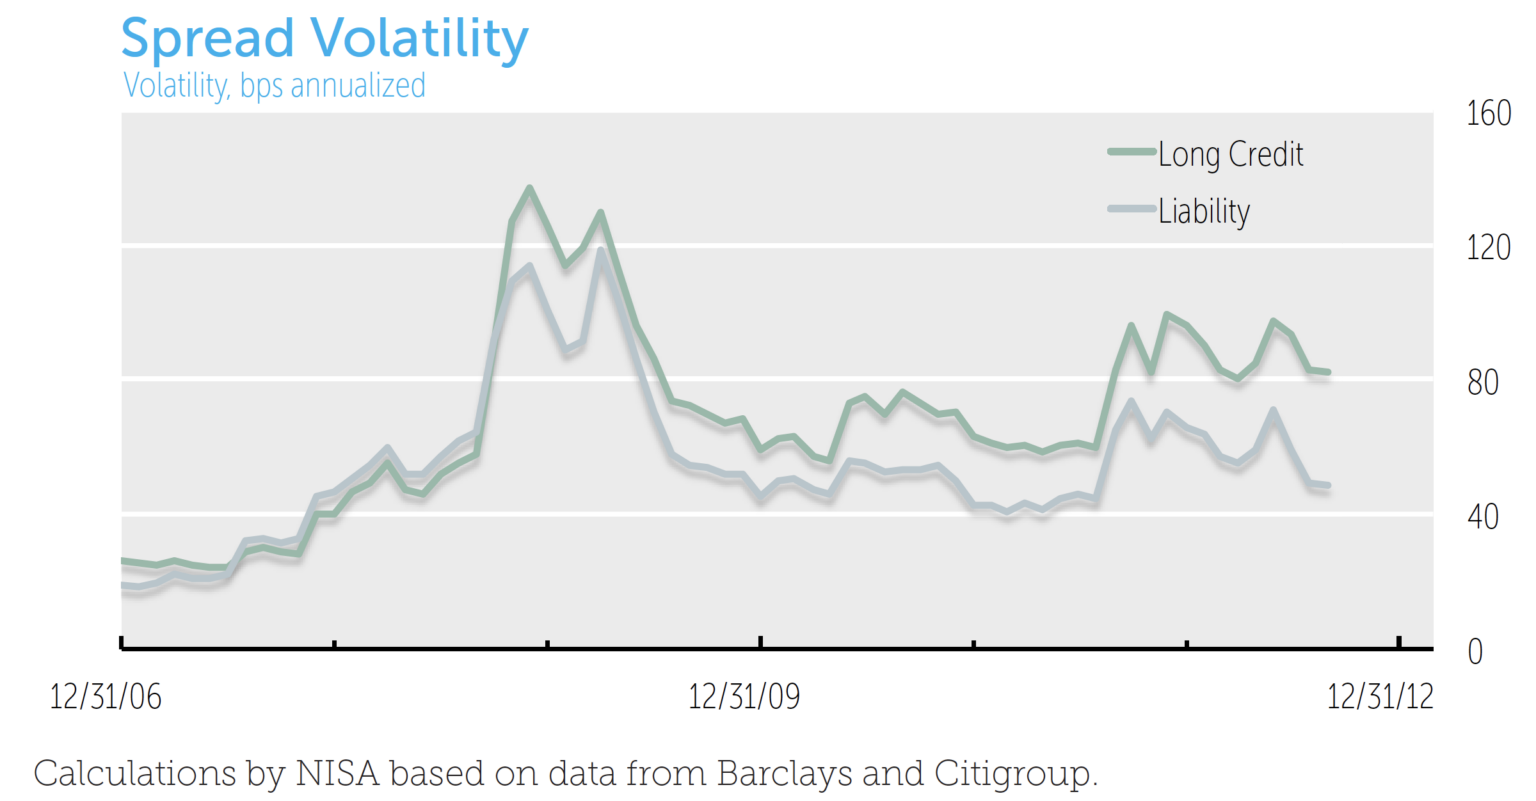
Bond Spread Volatility
The PSRX includes both liability spread and long credit spread volatilities. These are modeled as two separate spreads to reflect the basis risk often associated with hedging a pension liability. While credit quality and security composition differences are the primary reasons for monthly basis risk, differing treatment of downgrade events between credit and liability benchmarks can lead to significant performance differences.
Although a prospective estimate of spread volatility is difficult to observe, the PSRX uses the level of the spread as a reflection of spread volatility. The current OAS is multiplied by the standard deviation of relative spread changes (explained below), resulting in a spread volatility measure. By using the current OAS, we believe the PSRX spread volatility estimate responds rapidly to changing market conditions. Five years of history is used to determine the standard deviation of relative spread changes. The relative spread change is simply the percentage change in OAS over the prior period. For example, if spreads began the month at 100bps and ended the month at 110bps, that period would have a 10% relative spread change.
OAS data are readily available for computing the spread volatility of long credit markets. This is not the case for the liability. To find the liability OAS, the liability is valued using both Treasury and corporate discount curves. An internal rate of return (IRR) is calculated by NISA using both curves, the difference being the OAS of the liability.
The Treasury curve is fitted on a liquid set of non-callable US Treasury bonds using a B-spline technique on the forward curve. The corporate discount curve is based on corporate bonds of a similar credit quality and composition to the liability value derived from financial statements. Once the OAS for the liability is calculated by NISA, the procedure used to calculate long credit spread volatility is applied to the liability. The chart below illustrates the history of the estimates for long credit and liability spread volatility used in the PSRX.
Duration Measures
The PSRX requires duration estimates for the liability, long credit and long Treasury markets. The liability duration is estimated from 10-K data. The long credit and long Treasury durations may be taken from published index durations or calculated by NISA. The PSRX uses effective duration, based on par curve shocks, when possible.
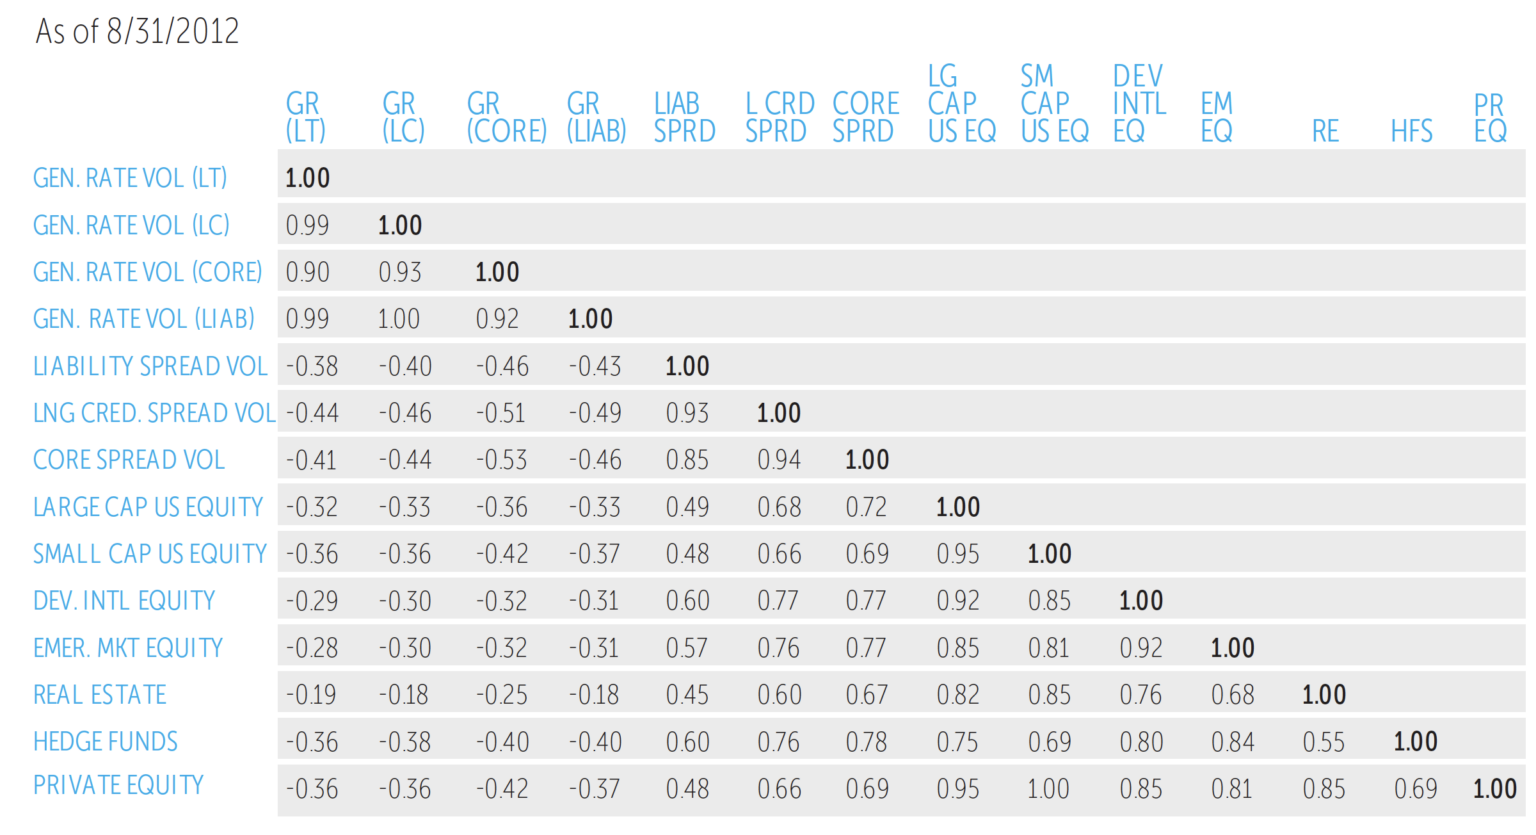
Correlation Measures
All correlation calculations rely on an underlying return series and are based on five years of historical data observed monthly. Fixed Income assets and the liability are dissected into risk components: general interest rate and spread risk. General rates are either observed directly (e.g. time series of returns on long Treasury allocations), or are implied by subtracting excess returns from total returns (e.g. Long credit market allocations). By using a unique general rate time series for each fixed income asset class, differences in yield curve exposure are acknowledged and measured. Spread correlations (liability and long credit) are based on the excess return.
Equity correlations are based on the total return of their respective equity indices. Real Estate correlations are based on the total return of US REIT indices. Hedge Fund correlations are based on the total return of broad based Hedge Fund indices. Additionally, Hedge Fund correlations are based on 59 observation points, due to the lag in posting of Hedge Fund index information. Private Equity correlations are based on US Small Cap returns series. The table below is a sample correlation matrix used in the PSRX.
Constructing the Liability
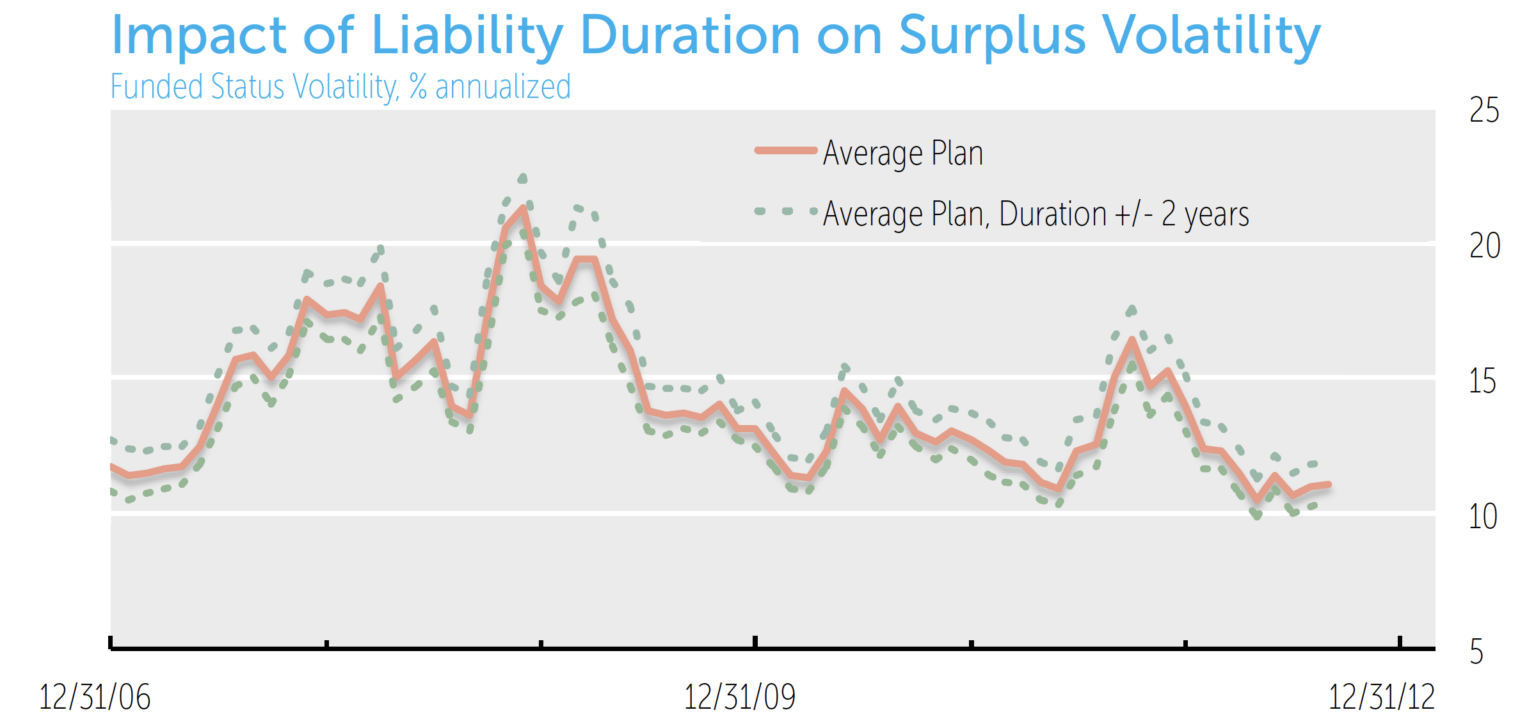
We construct the liability cash flow profile annually based on the average duration of the Defined Benefit (DB) plans selected. The shape of the cash flow profile is based on, in NISA’s experience, a typical defined benefit pension plan. The liability cash flows are set once per year and held constant until the following year. Cash flows are not assumed to age during the year. That is, with each passing month, and after all liability valuation measures have been updated, the cash flows are “reset” by pushing all cash flows back out a month.
The return volatility of the liability is then built as a function of the liability duration, general rate volatility, liability spread volatility, and the correlation between liability rate movements and liability spread movements as follows:

Since the liability construction is a critical element of the PSRX, we tested extensively to understand the ramifications of liability duration assumptions. The chart below illustrates the impact on the PSRX if the average plan duration is increased/decreased by two years. This helps to put a range on the consequence of any error in the duration assumptions.
Asset Class Construction
The PSRX models three primary asset classes: Equity, Fixed Income and Alternatives. Equity and Alternatives tend to be straight forward as they are built directly from their subcomponents: (Large Cap, Small Cap, International Developed and Emerging Markets), and (Hedge Funds, Real Estate and Private Equity) respectively. The Fixed Income asset class is constructed from two risk components: General Rate and Spread Risk. Consequently, Fixed Income volatility is a function of duration, interest rate volatility, spread volatility, and correlations between rates and spreads.
Portfolio Construction
Once each asset class is constructed, we apply portfolio weights. The asset allocation of the portfolio is based on information provided in 10-Ks and is rebalanced monthly. Additionally, funded status is updated to reflect returns on assets and liabilities throughout the year.
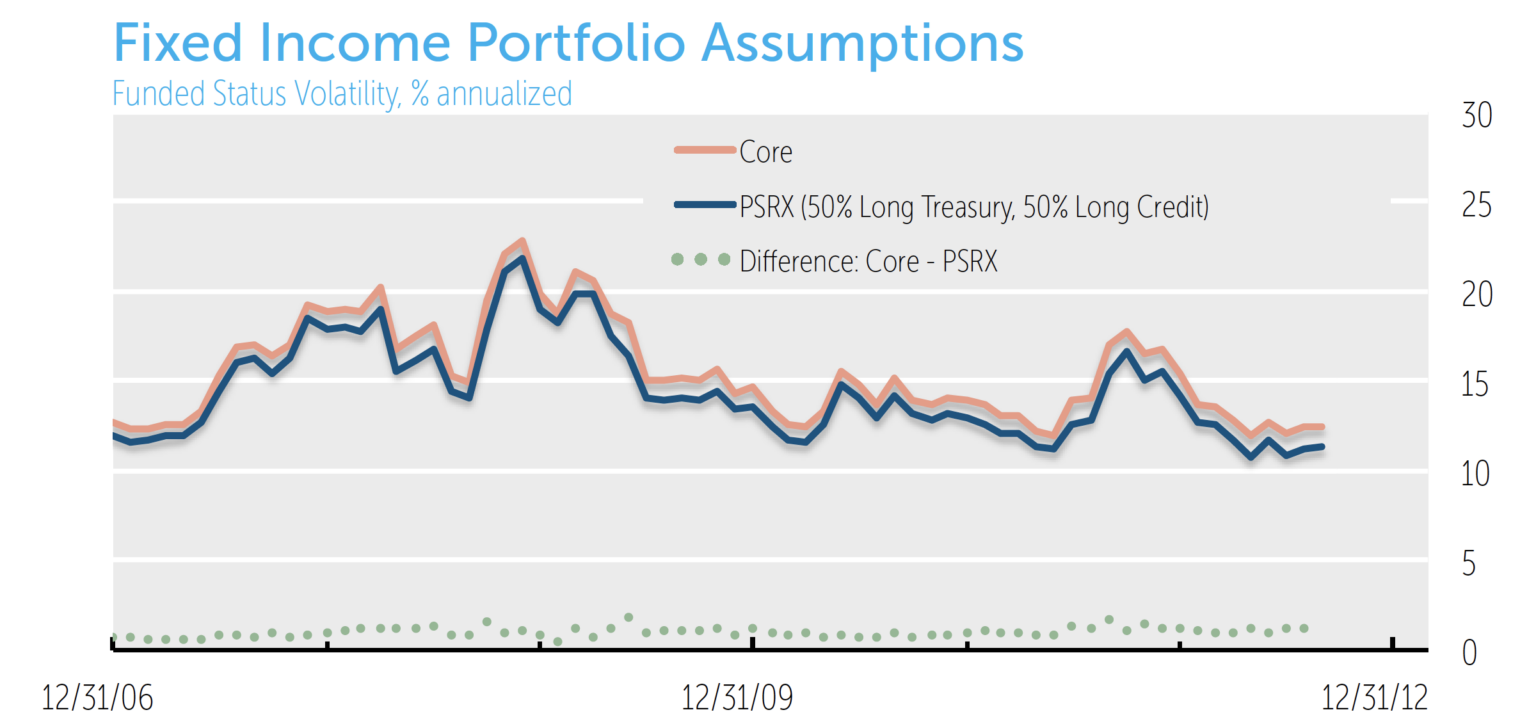
The Fixed Income allocation is assumed to be an equal blend of long Treasuries and long credit. Specifics regarding the typical fixed income allocation are unavailable in public filings. Additionally, if a plan has labeled cash as an asset class, the allocation is excluded from the portfolio calculation. Given the general movement in the pension fund community to long duration over the past several years, the PSRX has made a similar assumption. In general, long duration Fixed Income assets results in a lower funded status volatility than short duration assets because the liability and a longer duration Fixed Income portfolio have offsetting risks. The chart below outlines the impact of a long duration versus core allocation assumption for the fixed income portion of the assets.
Finally, portfolio volatility can now be calculated using the statistical addition of the long Treasury, long credit and risk asset components of the portfolio.
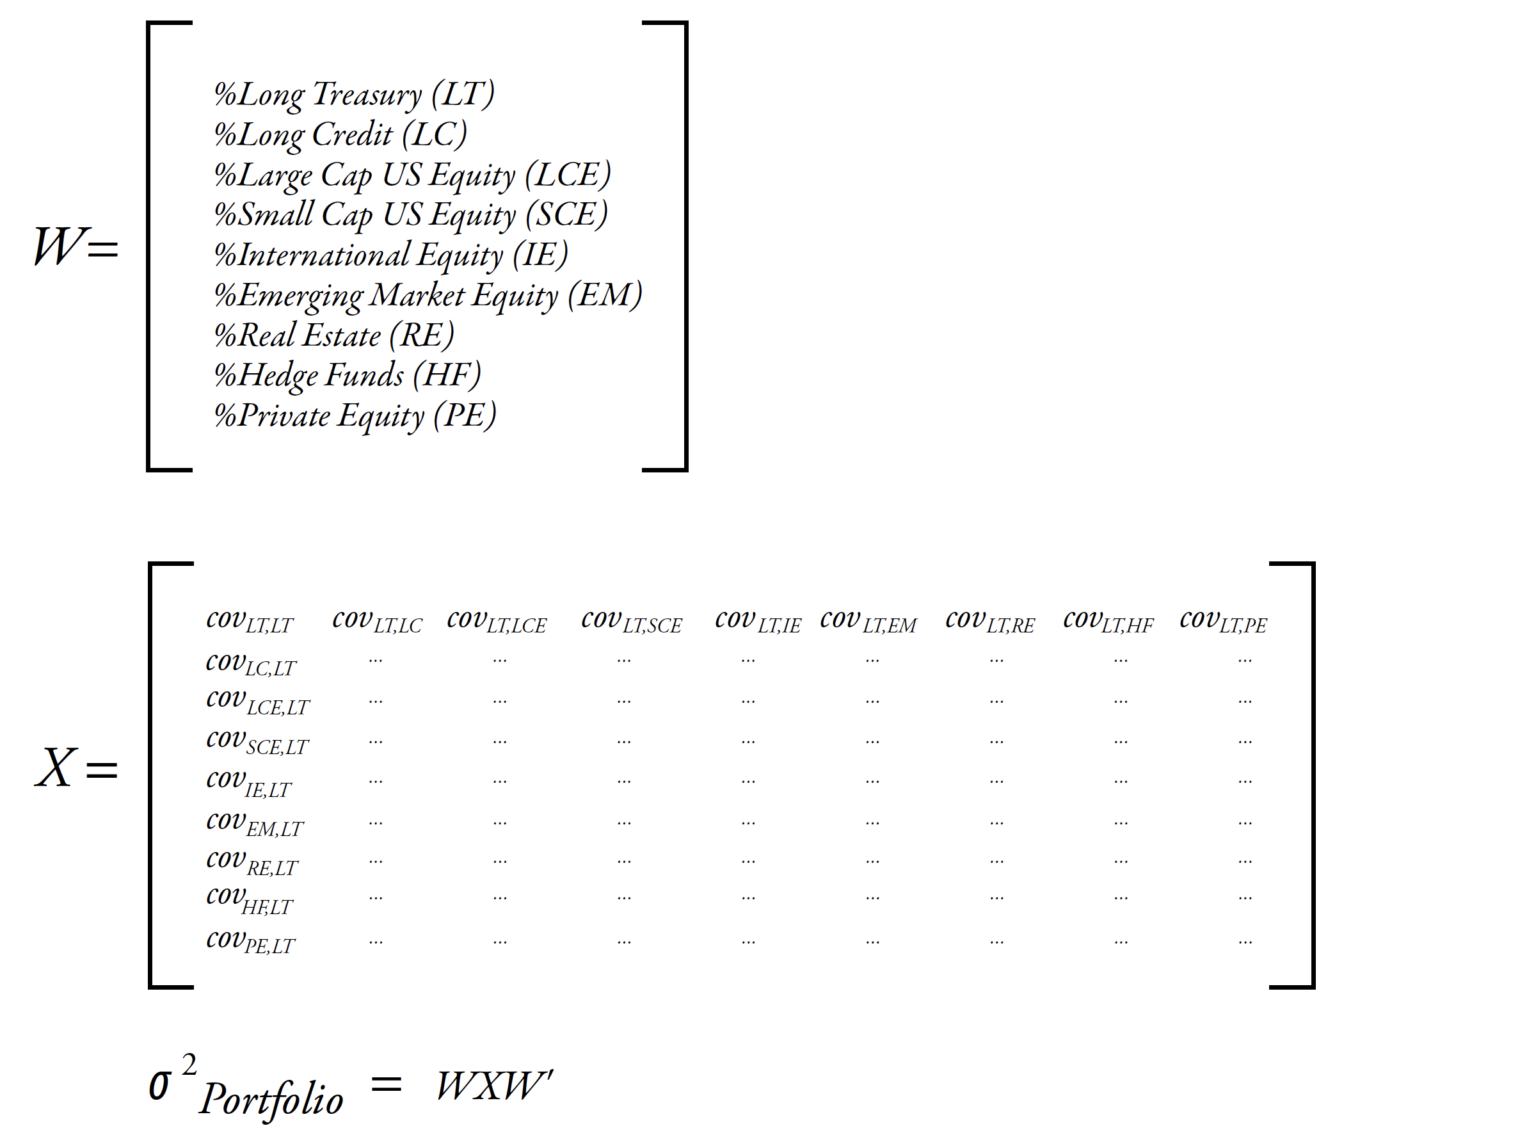
Funded Status Volatility
Once the portfolio and liability volatility are calculated, the final step is to compute the funded status volatility. This is simply the statistical difference between the portfolio and liability.

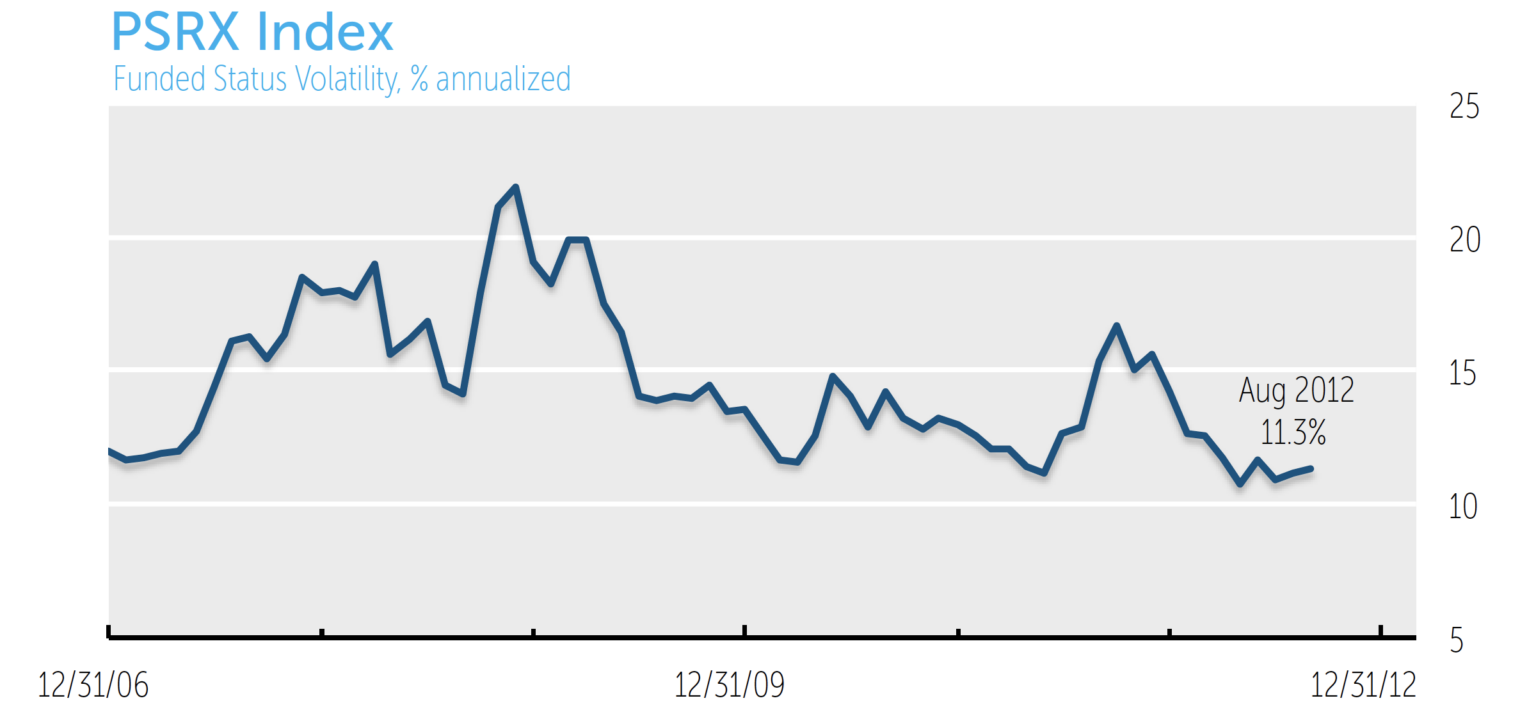
Using the equation above, below is the historical PSRX index.
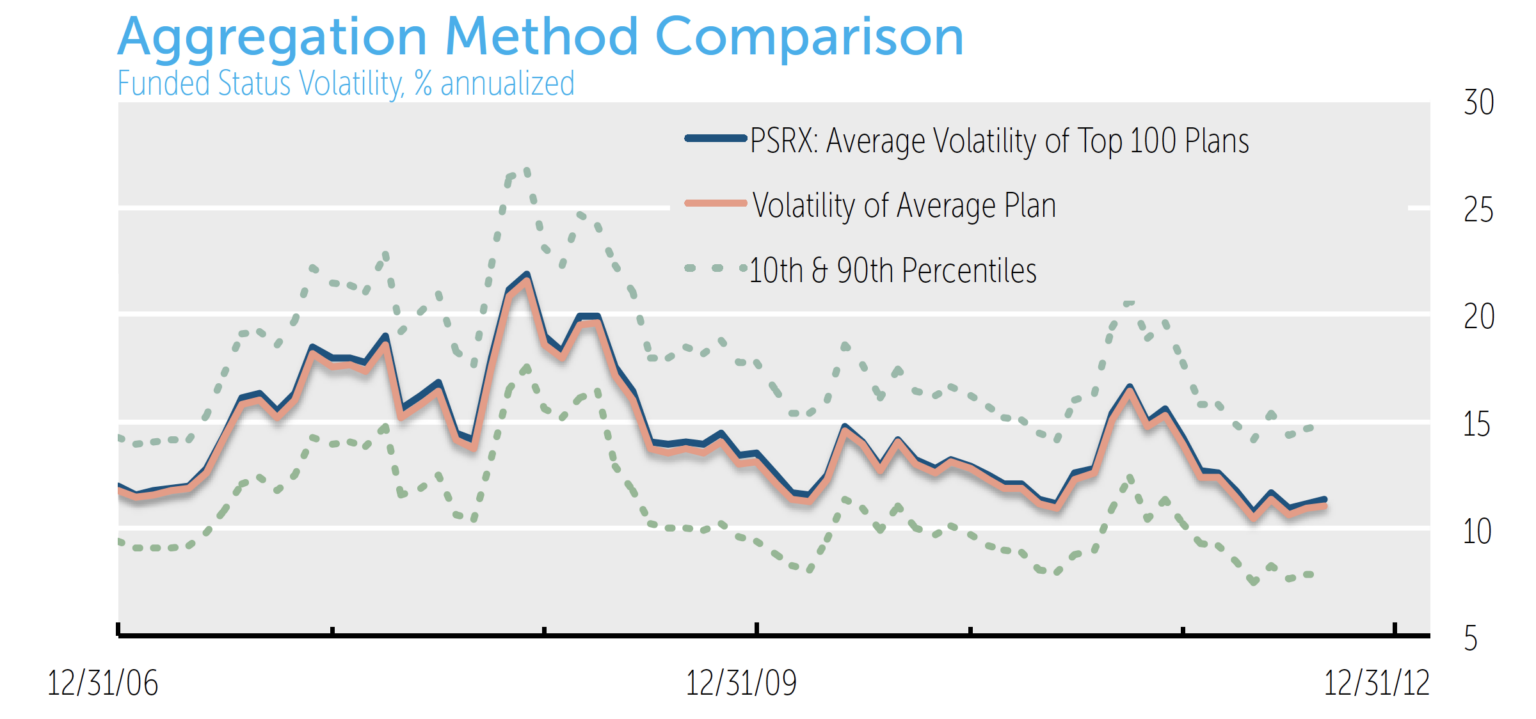
Aggregation Methodology
The process above determines funded status volatility for a given plan. To aggregate this data we considered using the average funded status volatility of the top 100 plans or the funded status volatility of the average plan. We elected to calculate a funded status for each plan and aggregate the results due to the non-linear nature of the funded status volatility calculation and each plan receives an equal weighting in the PSRX. One advantage of this methodology is the ability to create percentile bands showing the distribution of funded status volatility among plans. The graph below illustrates the difference between aggregation methods.
Other Key Metrics
The PSRX serves as a benchmark index to gauge the current funded status volatility of the defined benefit pension community, not a specific plan’s funded status volatility. The three primary drivers of funded status volatility are the plan’s funded status, risk asset allocation and duration of the liability. In order to help plans understand where they are relative to other firms, NISA publishes tables that provide funded status volatilities for three different assumptions on funded status, liability duration, and risk allocation. The table below outlines the permutations they provide.
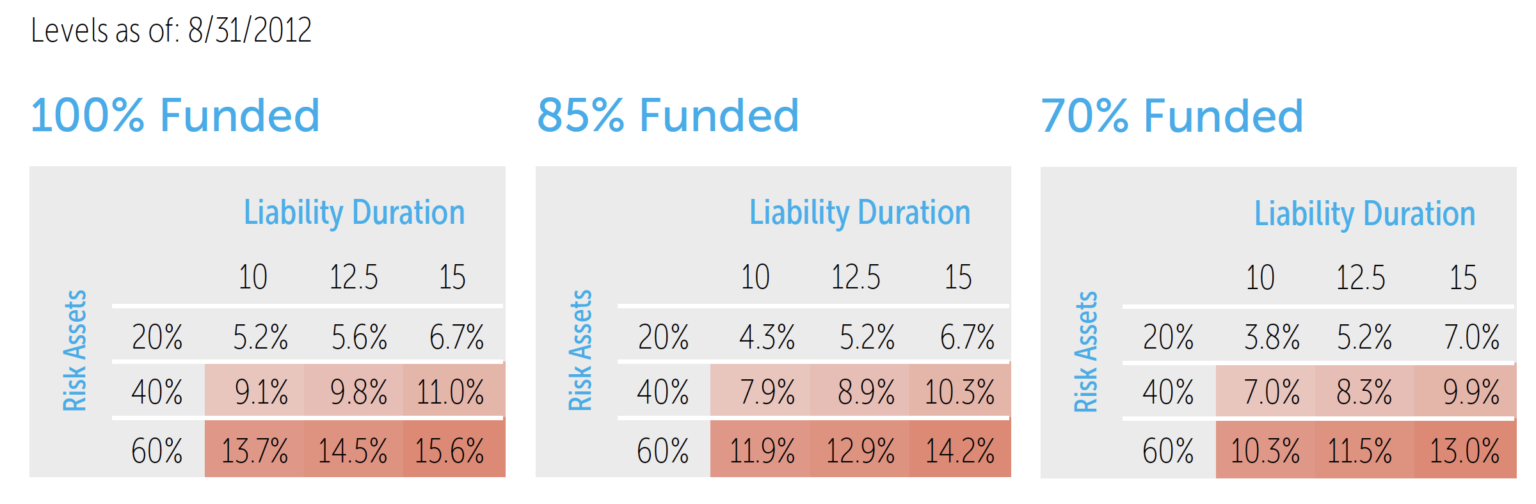
Our intent is to provide a means by which any plan can reasonably identify its funded status volatility by looking up its plan specifics as closely as possible in these tables. Interpolating between points is also reasonable for those seeking extra precision.
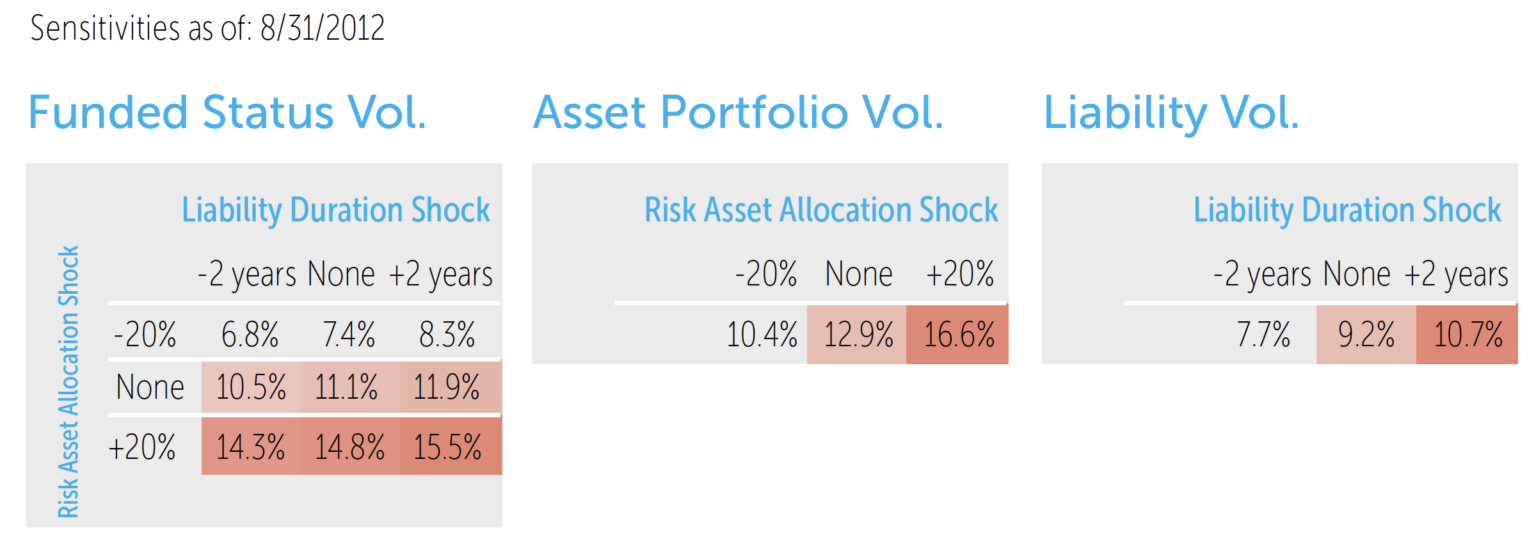
In addition to the published funded status volatility numbers, the liability and portfolio volatilities are available on the PSRX website. Additionally, to understand the impact of duration and allocation assumptions on the PSRX, sensitivity measures are made available for the most recent index observation. The tables below illustrate these sensitivities. By showing the resulting volatility index level of certain shocks are more to the input assumption.
Future Work
We expect the PSRX to evolve continually to reflect changing market conditions, availability of new securities, or new understandings of pension fund risk. We welcome input from the pension community on ways to further improve the index offerings.
Index Controls
The methodology for the PSRX is reviewed semi-annually by NISA. NISA is responsible for reviewing the methodology, index revisions and implementing internal controls for the index. Additionally, NISA decides on recommended index improvements. Any modifications to the index methodology can be found in the PSRX section at www.nisa.com.
Distribution/Dissemination
The PSRX is expected to be released by the sixth business day of every month, and is available at www.nisa.com.
Questions regarding the PSRX can be e-mailed to NISA’s index group at [email protected].