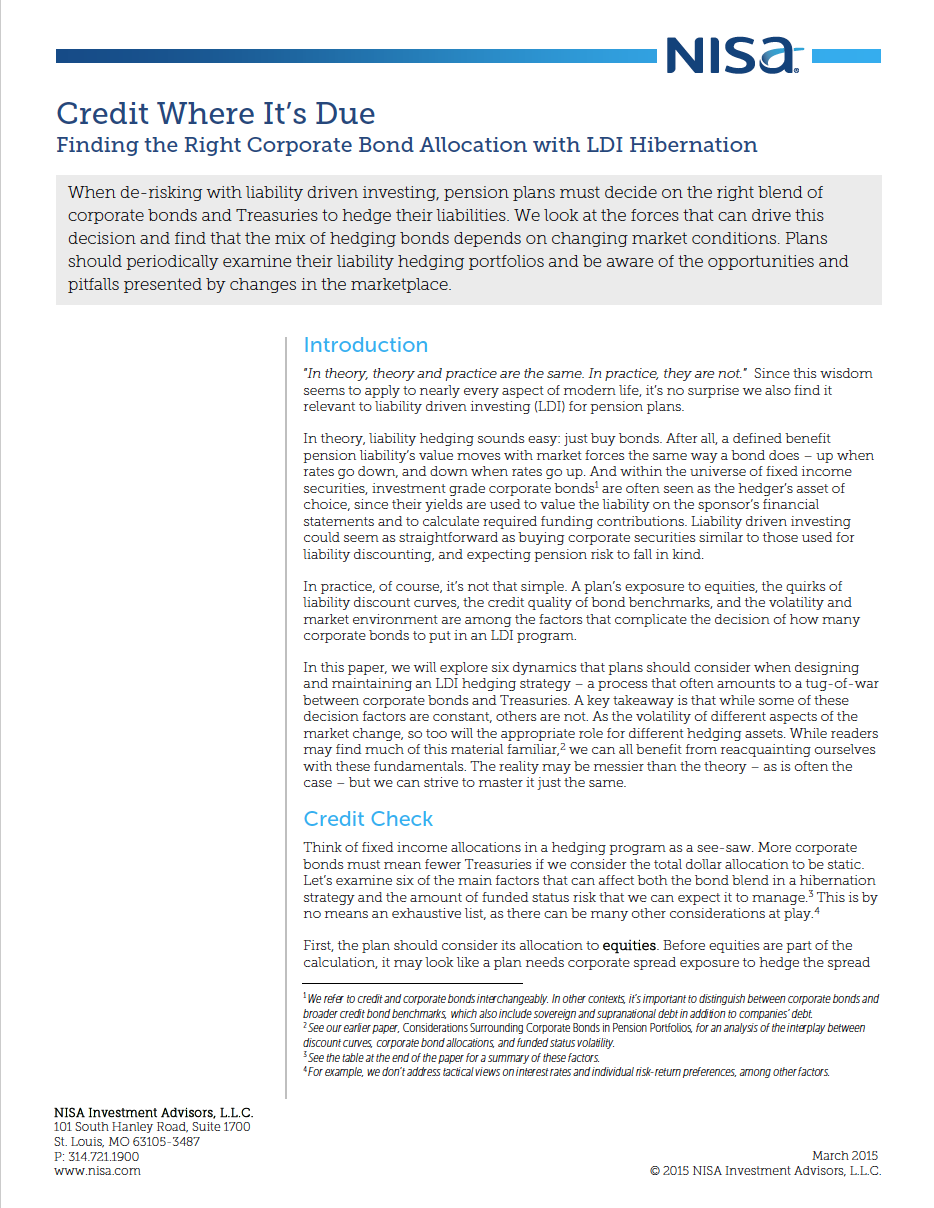
Finding the Right Corporate Bond Allocation with LDI Hibernation
Introduction
Credit Check
Think of fixed income allocations in a hedging program as a see-saw: More corporate bonds must mean fewer Treasuries.
The Factors in Action
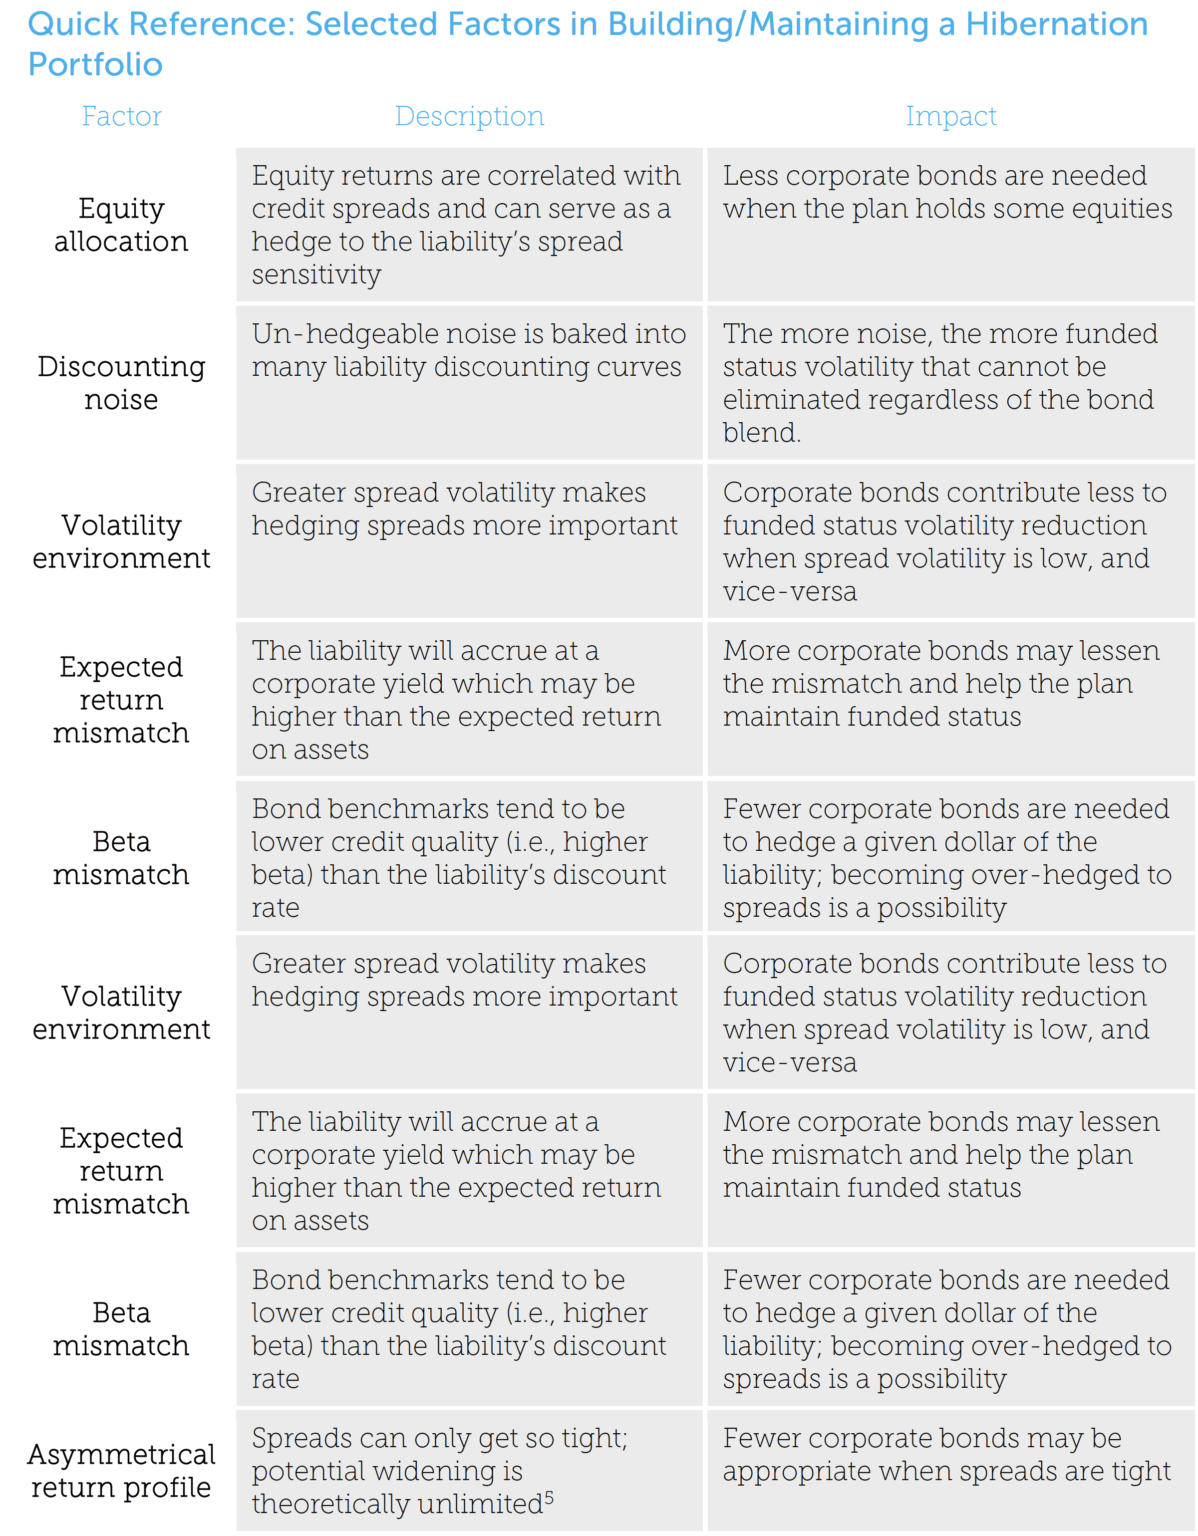
A major takeaway from this analysis is that the most effective allocation to credit is not static.
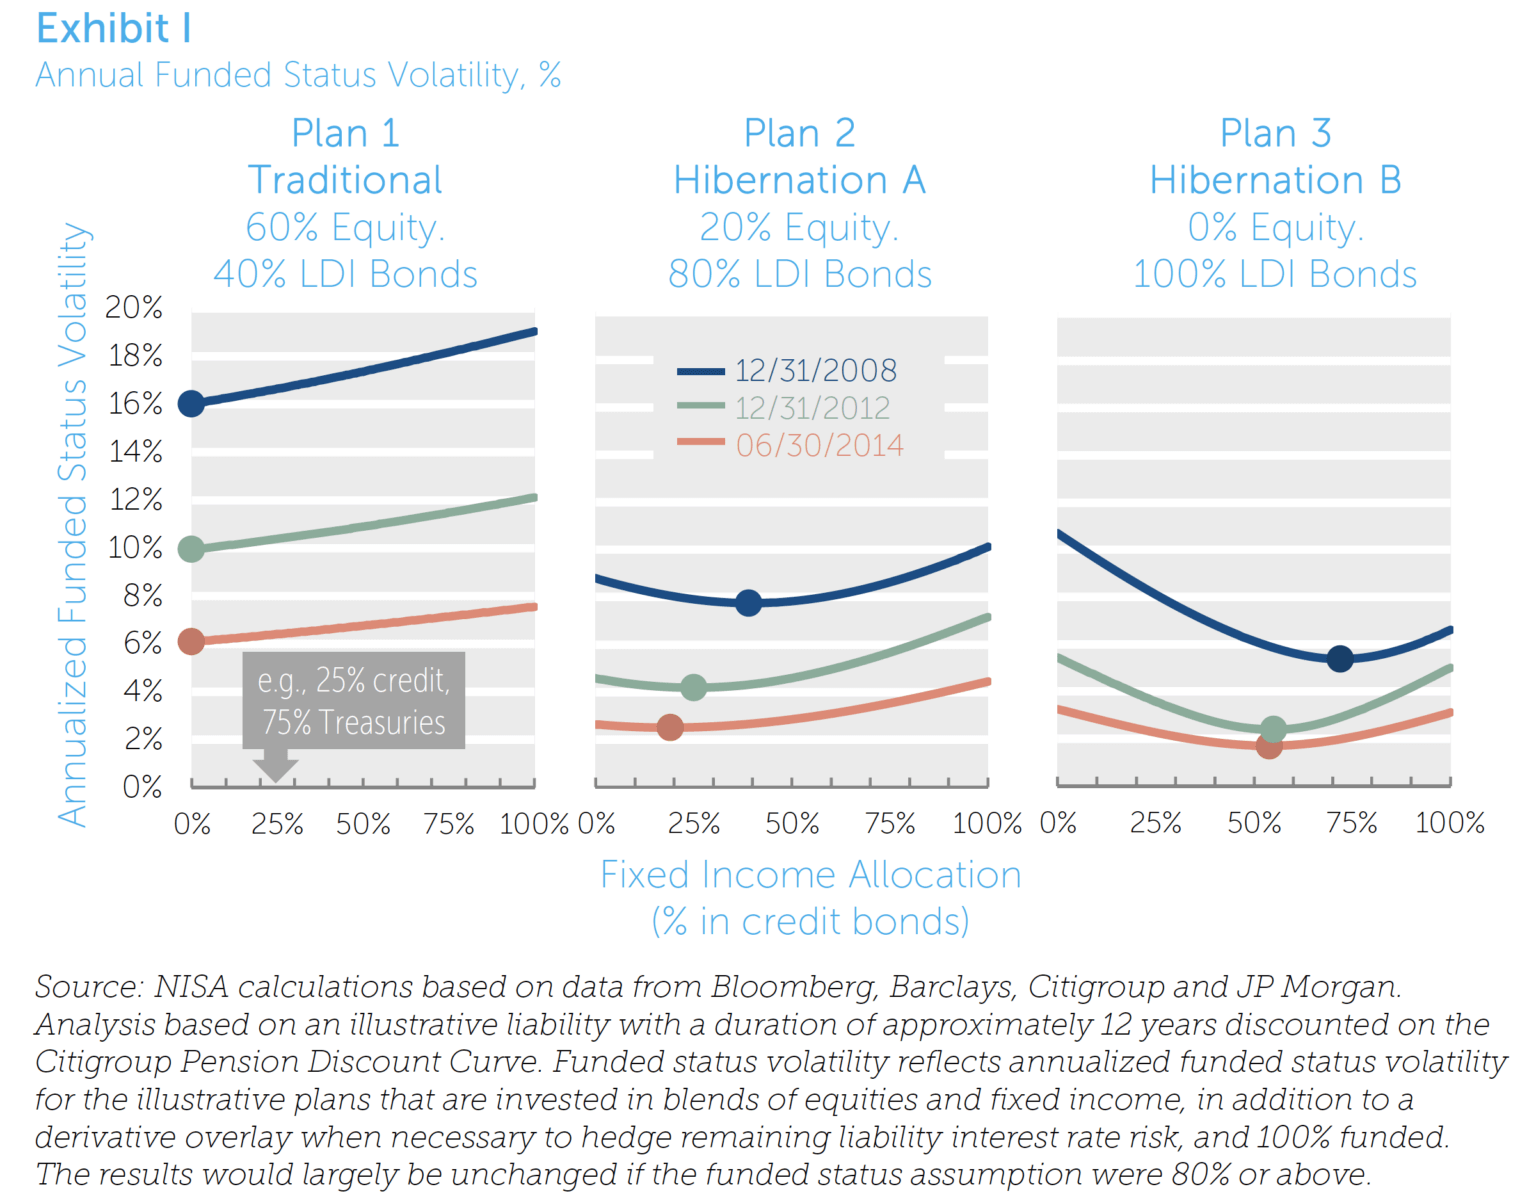
From these graphs we can pick out the six factors that we discussed above. We can see the impact of equity allocations by noticing how the funded status minimizing allocation to credit in Plan 1 is zero in all three years, since its equity allocation already hedges (indeed, over-hedges) the liability’s spread component. But by the time we reduce equities to only 20% in the second plan, some allocation to credit may help hedge that spread risk and reduce expected funded status volatility. If the equity portfolio is eliminated entirely as in Plan 3, still more credit is needed to keep funded status volatility as low as possible.
The effect of discounting noise is visible in the fact that no allocation is able to reach the 0% funded status volatility point, even with all assets in the hibernation program. For that
100% fixed income plan, the few remaining percentage points below the optimal allocation reflects the volatility from the noise component that cannot be hedged. As an aside, when the liability is discounted at more economic discount rates (.e.g. Treasuries) with much less noise, this gap can be narrowed significantly.
We can also see the changing volatility environment revealed in these lines. Prospective volatilities of equities, interest rates, and spreads were at a high point at the end of 2008, pushing the blue lines up. They were lower by 2012 and had fallen even further by 2014, bringing funded status volatility down along the way, as seen by the lower green and red lines.
While the absolute level of volatilities drives the altitude of the line, its shape is more a product of the relationship and relative scale of different volatility components. Normally, credit spreads are not expected to be as volatile as general interest rates. But in 2008, credit spread volatility spiked to such an extent that it rivaled that of general rates. That explains the steep slope of Plan 3’s blue line, indicating that getting the right credit allocation was critical at that time to hedge that risk factor. In 2014, however, spread volatility was absolutely low and had also returned to being only a fraction of general interest rate risk volatility. In that context, what resembled a bowl in 2008 looked more like a flat plate in 2014. The flatter this curve, the less the credit/Treasury allocation question mattered, since in either case the bigger risk factor – general interest rates – was hedged.
The best approach is to consider these forces in concert, and assess whether a tune-up is needed as the market conditions and the plan's asset allocation warrant.
Conclusion