

The Phillips Curve describes the relationship between unemployment and inflation. First proposed in 1958, the theory holds that a low unemployment rate reflects a tight labor market that requires firms to raise wages to attract scarce labor. The Phillips Curve is therefore supposed to be downward sloping. Economists have since extended the model in a variety of ways: utilizing an assortment of wage and price inflation measures, introducing the concept of the natural rate of unemployment, and attempting to incorporate inflation expectations. Though the various models have been debated over the years, the general concept of a tradeoff between resource slack and inflation has crystallized into a bedrock principle of monetary policymaking. Fed officials including President Williams have cited low unemployment as a primary factor motivating the Fed to proceed with balance sheet normalization and rate hikes this year despite inflation running consistently below target.
“I view [the decline of inflation in mid-2017] as just part of the variability that’s going to happen. I don’t see any signs that somehow the inflation process is fundamentally changed. I’ve been doing this a long time, and the Phillips Curve has been declared dead far more times than Mark Twain.”
-San Francisco Fed President John Williams, New York Times interview, 10/17/17
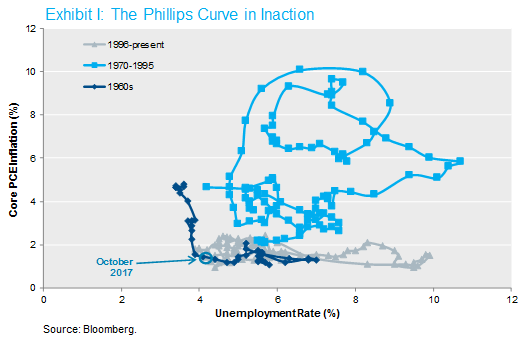
Unfortunately for proponents of the Phillips Curve framework, the data haven’t fit the theory in about 50 years. The chart in Exhibit I below plots the history of the Phillips Curve in the United States since the 1960s. In the first half of that decade, inflation was stable between 1 and 2 percent. But when the unemployment rate fell below 4% after 1966, inflation increased sharply to reach 4.8% by the end of the decade. The Phillips Curve was kinked. A series of supply side shocks and policy errors in the 1970s caused stagflationary combinations of high inflation and high unemployment, which contradict the logic of the Phillips Curve. The Volcker disinflation followed in the early 1980s, causing inflation to decline steadily over the next decade. Since 1996, the Phillips Curve has been a flat line with inflation stable near 1-2 percent. Despite a wide range of economic conditions over this period, there has not appeared to be any tradeoff between unemployment and inflation.
Why has the Phillips Curve remained so influential among central bankers despite its empirical failure? Perhaps the most compelling allure of the model is its simple logic. In order to convince an economist that the Phillips Curve is broken, you need to convince her that the laws of supply and demand don’t apply to the labor market. Furthermore, academic research has yielded several plausible explanations for the recent flatness of the Phillips Curve.
- Shadow slack: economists generally agree that the headline unemployment rate has underrepresented the true magnitude of slack in the labor market since the crisis.
- Anchored inflation expectations: many also believe that inflation expectations have become very well-anchored — perhaps as a result of the Volcker disinflation and credible inflation targeting — leading to relatively stable inflation outcomes near 2% regardless of economic conditions.
- Globalization: the removal of geographic barriers segmenting global labor markets has likely changed the inflation process to make goods prices less dependent on the employment status of US workers.
The Amazon effect: improved price transparency and margin pressure might have changed consumers’ shopping behavior in ways that reduce firms’ pricing power. - Downward nominal wage rigidity: the reluctance of employers to give their workers an outright wage cut likely prevented inflation from falling as much as it would have otherwise given how far unemployment rose after 2008.
- The shifting composition of the labor force: high-wage baby boomers are retiring and being replaced in the labor force by millennials earning low wages in entry level jobs. This holds down the average pace of wage growth.
We’ll discuss some of these concepts in greater detail in future notes, but the question facing the Fed today is this: has the inflation process in the US economy changed so fundamentally that there is no longer a tradeoff between inflation and resource slack? Or is the Phillips Curve merely being distorted by factors like those above on a temporary basis? If research concludes that the relationship between inflation and unemployment — the two sides of the Fed’s dual mandate — has changed permanently, then a fundamental reassessment of monetary policy objectives and strategies would be in order. For example, if inflation is so well-anchored that it will never veer far from target, then there is little downside to pushing the unemployment rate to extremely low levels, such that nearly every employable adult has a job. Alternately, perhaps the globalization of the labor market has advanced to such a degree that the Fed needs to consider the amount of slack in the Chinese workforce, with its millions of new entrants leaving the countryside to move to the cities each year. Changes like these would take years to implement and would certainly spur vigorous Congressional debate about the Fed’s mandate.
With the unemployment rate sitting at 4.1% today and forecasted by many to dip down into the 3s for only the second time since the 1960s, hawks on the FOMC fear a repeat of the kinked Phillips Curve experienced during that decade. Minneapolis Fed President Neel Kashkari has dismissed such concerns as “ghost stories” from a distant economic era. Chair Yellen has said that, because monetary policy works with long and variable lags, the Fed can’t afford to wait until they see the whites of inflation’s eyes before gradually removing accommodation, and we expect Jerome Powell to maintain the same stance once he takes over in February. Doves like Governor Lael Brainard warn that even the current glacial pace of rate hikes risks disrupting the momentum of the recovery and potentially inducing a recession at a time when the Fed would have limited ammunition with which to respond. This policy debate will be settled in large measure by the response of inflation data if unemployment continues to decline as expected into 2018. In other words, by the shape of the Phillips Curve. To paraphrase Twain, reports of its death may yet turn out to have been greatly exaggerated.
To download a PDF version, please click here.